Bitcoin’s Expanding Diagonal: Final Surge or Bubble’s Last Gasp?
People with "Laser-Eyes" might not like the Outlook. But the Technical Setup for BTC is quite clear. Final Extreme Rally. Then massive top - and a Crash of a magnitude which is expected by few.

Major Expanding Diagonal – Final Phase of a Cycle
Bitcoin’s long-term chart appears to be forming a Major Expanding Diagonal – a broadening five-wave pattern that has been unfolding for over a decade. In Elliott Wave terms, this structure is now in its final phase, meaning the fifth and last wave of the diagonal is nearing completion. Such expanding megaphone patterns are rare and dramatic: they signal that price swings are getting larger each cycle, culminating in an extreme move.
Crucially, this finale can resolve in one of two ways.
Either this expanding diagonal marks the beginning of a new macro market, or it represents the end of a massive speculative bubble.
I want to be very clear: both interpretations lead to the same conclusion in the short-term(!) — one final rally is still missing.
Technically, the structure is not complete. The diagonal still requires a final fifth wave to the upside. That is why I continue to argue that Bitcoin is likely headed for a final, explosive rally to a new all-time high before any larger top is in place.
But what comes after that rally is where the real risk lies.
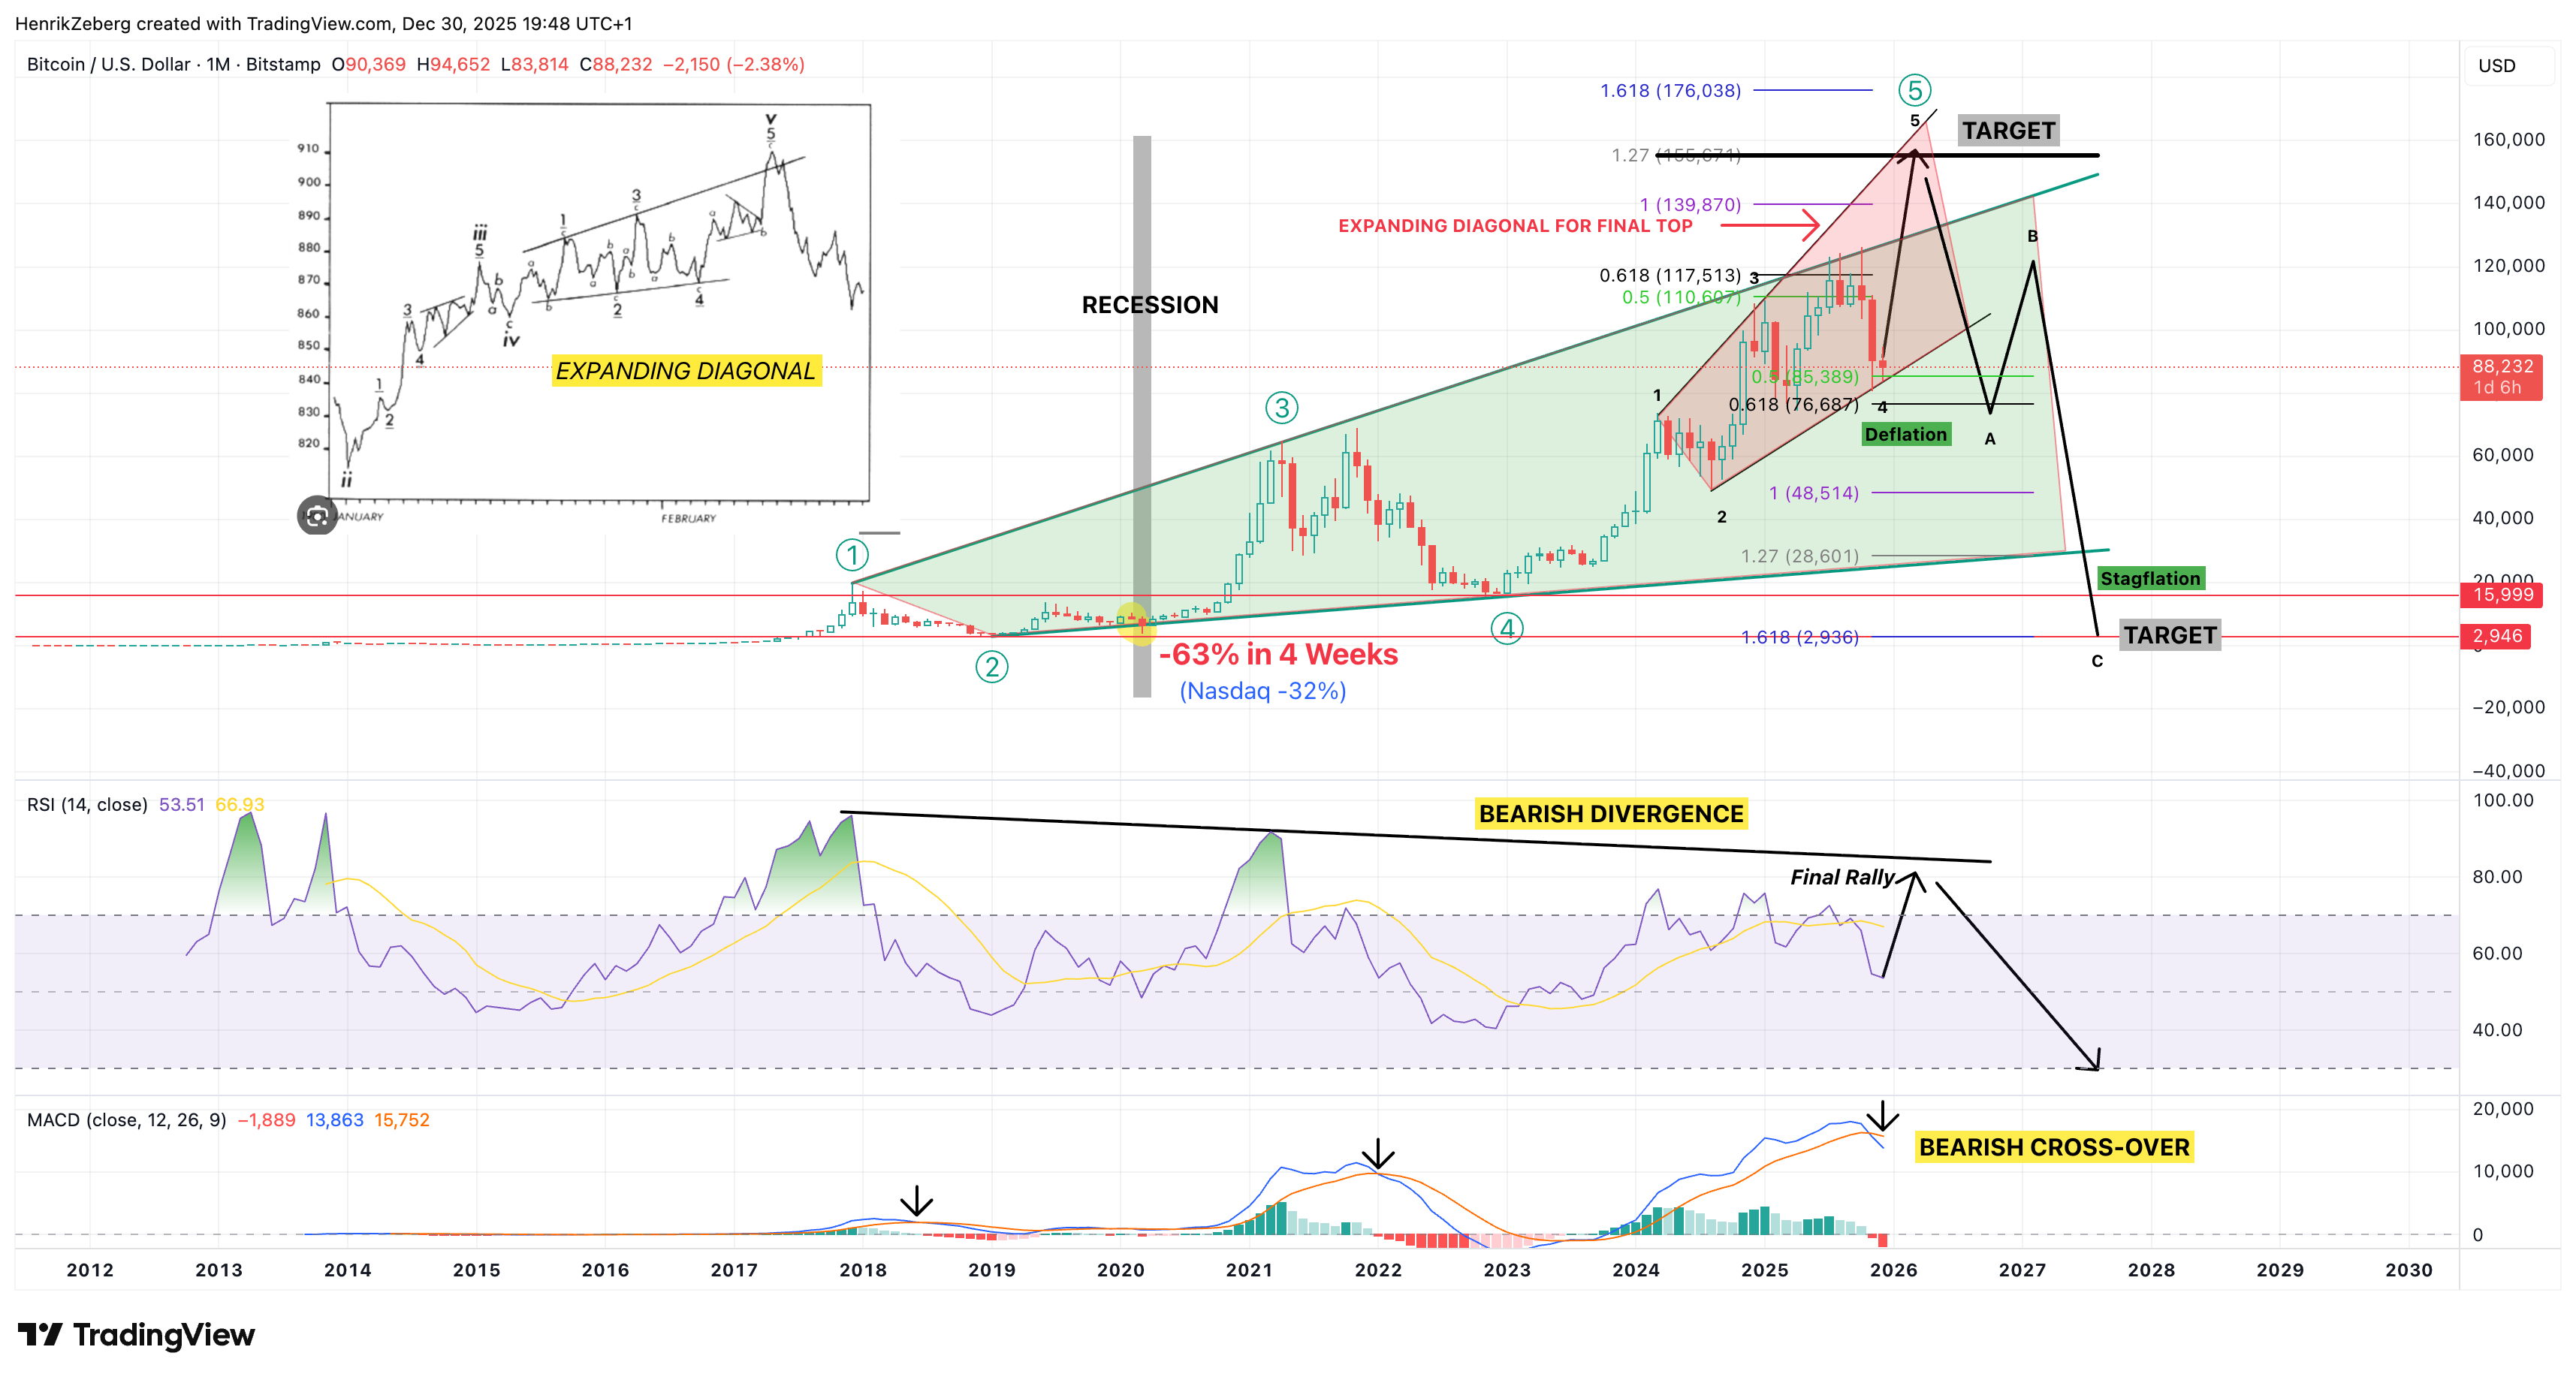
Short Term: One Final Rally to a New ATH (~150K)
From a purely technical perspective, the bullish case in the short term is strong.
The expanding diagonal is incomplete. Wave five is still unfolding. That implies one final upside acceleration, a classic blow-off phase where price pushes far above what fundamentals or sentiment would normally justify.
My base case is that Bitcoin completes this structure with a rally into the 150K area. That level aligns with Fibonacci extensions of the diagonal and fits well with the broader late-cycle behavior we see across risk assets. Equities, credit, and crypto all appear to be in the final stage of a liquidity-driven surge, not yet a confirmed top.
Importantly, I do not believe this rally represents safety, strength, or a new stable regime. It is the last phase of excess. These final moves always look convincing. They always feel unstoppable. And they always convince the largest number of participants that “this time is different.”
It never is.
Multi-Year Bearish Divergences – Momentum Is Fading
While price continues to grind higher, the internal condition of the market is deteriorating badly.
Bitcoin is displaying massive, multi-year bearish divergence across momentum indicators. RSI has been making lower highs for years, even as price pushes to new highs. MACD momentum has been fading and is now rolling over on higher timeframes.
This is not a short-term signal. This is structural exhaustion.
When price rises while momentum weakens over several cycles, it tells us one thing: the trend is running out of fuel. Each new high requires more effort and delivers less follow-through. This is exactly what we expect to see near the end of large speculative cycles.
I want to stress this point: multi-year divergence is not noise. It is one of the most reliable warnings of major trend reversals. It does not tell us the exact top — but it tells us the move is dying.
The market is being held up by liquidity, not strength.
Not a Safe Haven: Crash Risk in a Recession
Bitcoin is not a hedge against recession. The data is unequivocal.
During the short recession in early 2020, Bitcoin collapsed by roughly 63% in just a few weeks. That was a recession that lasted barely two months. Even in that brief shock, Bitcoin performed dramatically worse than equities.
This matters.
Bitcoin behaves as a high-beta risk asset, not as digital gold. When liquidity dries up, Bitcoin does not protect capital — it destroys it.
Now consider the implications.
What happens if the next recession lasts 9 months, 12 months, or longer? What happens if equity markets experience a drawdown comparable to the 2000–2002 tech crash, where Nasdaq fell 80–85%?
Bitcoin has always fallen more than equities during major downturns.
So the idea that Bitcoin is immune to a deep recession is not just optimistic — it is historically false.
Downside Targets: How Low Could Bitcoin Go?
Here is where honesty matters.
In a massive expanding diagonal, the minimum corrective target after completion is the bottom of wave four. In Bitcoin’s case, that is the December 2022 low around 15–16K.
That is the absolute minimum for a Target.
However, in most cases, expanding diagonals retrace far more deeply. The typical resolution is a full retracement to the origin of wave two.
