

Final Warning: The Emperor’s New Clothes and the Coming Economic Crash
“Ignored Signals, Repeating Mistakes: Why This Time Is Not Different - and yet very Different”

The Boy Who Cried “Crash” – And Was Right
I feel like the boy in The Emperor’s New Clothes – pointing out an uncomfortable truth that others are willfully ignoring. Back in late 2021 and 2022, virtually every economist and pundit was predicting an imminent recession. I did not. I looked at my models and the data and instead predicted a powerful market rally – and that’s exactly what we got in 2023-2025. I stood virtually alone with this contrarian call, and was proven correct. The S&P 500 indeed exploded to new all-time highs, defying the skeptics.
Again in April 2025, when bears were certain a downturn was due, I said no, the market will rally to all-time-highs (ATH). We are currently in the process of breaking through the former ATH.
But this isn’t a victory lap – it’s a final warning.
Just as in 2007-08, all the warning signs of a massive crisis are flashing red, yet most analysts and economists choose to ignore them. History doesn’t repeat, but it rhymes – and today’s rhyme looks eerily like 2007, or even 1929. We are approaching what I believe will be a financial and debt crisis larger than 2008 – in fact, potentially the biggest since the 1930s Great Depression. I hope I’m wrong. But the data – and my Business Cycle Model – are screaming otherwise. Consider this article my attempt to “ring the bell” at the top, even if no one else hears it.
“Nobody really rings a bell at the top,” as I recently reminded viewers on wealthion.com – meaning most people won’t recognize the peak until it’s far too late. My goal here is to lay out all the evidence that the economic “Emperor” is, in fact, wearing no clothes. The signs were there before the 2008 crash (and were dismissed), and they’re here again now.
Let’s walk through them one by one – from my Business Cycle Model’s Titanic-like warning, to extreme market bubbles, to cracks in housing and labor, to a coming “everything bubble” implosion. And finally, let’s discuss what comes after the crash – and why it could usher in a dangerous stagflationary era.
Buckle up; this is the case for an approaching storm that few expect – but everyone should.
“The Zeberg Business Cycle Model”: Titanic Has Hit the Iceberg
Zeberg Business Cycle Model (June 2025): The Leading Indicators index (red) has plunged below its critical baseline (“hit the iceberg”), reliably heralding recessions (gray bars). The Coincident index will follow and cross down as well (“the ship sinking”), confirming the recession.

My Business Cycle Model distills leading economic indicators (things like yield curves, housing permits, new orders, etc.) and coincident indicators (employment, industrial production, income, etc.) into composite indices. Historically, the leading index turns down before recessions, while the coincident index falls during recessions. Think of it like the Titanic: when the leading index (red line) crashes through a certain threshold – that’s the moment the ship has hit the iceberg. The damage is done; a recession becomes inevitable. The actual sinking (recession) is confirmed when the coincident index (also red in the lower panel) subsequently crosses below its baseline.
We are clearly in the late phase of the cycle right now – in fact, my leading index already plunged below the danger line in late 2024, indicating the “iceberg moment” has occurred. In previous cases (going back many decades), once the leading index broke down like this, a recession followed every time.
The model has accurately predicted recessions for ~80 years, and it’s now screaming that a downturn is ahead. Coincident indicators have not collapsed yet, but they’re rolling over – we’re essentially taking on water. In other words, the Titanic will sink; the damage is irreversible.
All the classic precursors of recession are present. The Conference Board’s Leading Economic Index has been falling steadily, yield curves have been deeply inverted for months, and my own composite of leading data is in free-fall. This is exactly what we saw before 2008. Then, as now, many brushed off the warning signs (housing slowdown, credit tightening, an inverted yield curve) until it was too late. I refuse to let that happen without sounding the alarm. As I said in a recent interview, “all the signs are there… we have the largest asset bubble ever, so I find it difficult why people think a recession is not at least a probability at this point” wealthion.com. We’ve hit the iceberg – a recession in 2025-26 is almost assured.
The Fed’s Blind Spot: Ignoring the Consumer – A Historic Error
U.S. Consumer Confidence (blue) vs. Unemployment Level (red, inverted scale). Despite very low unemployment, consumer sentiment collapsed to recessionary lows – a divergence signaling the consumer is in distress.
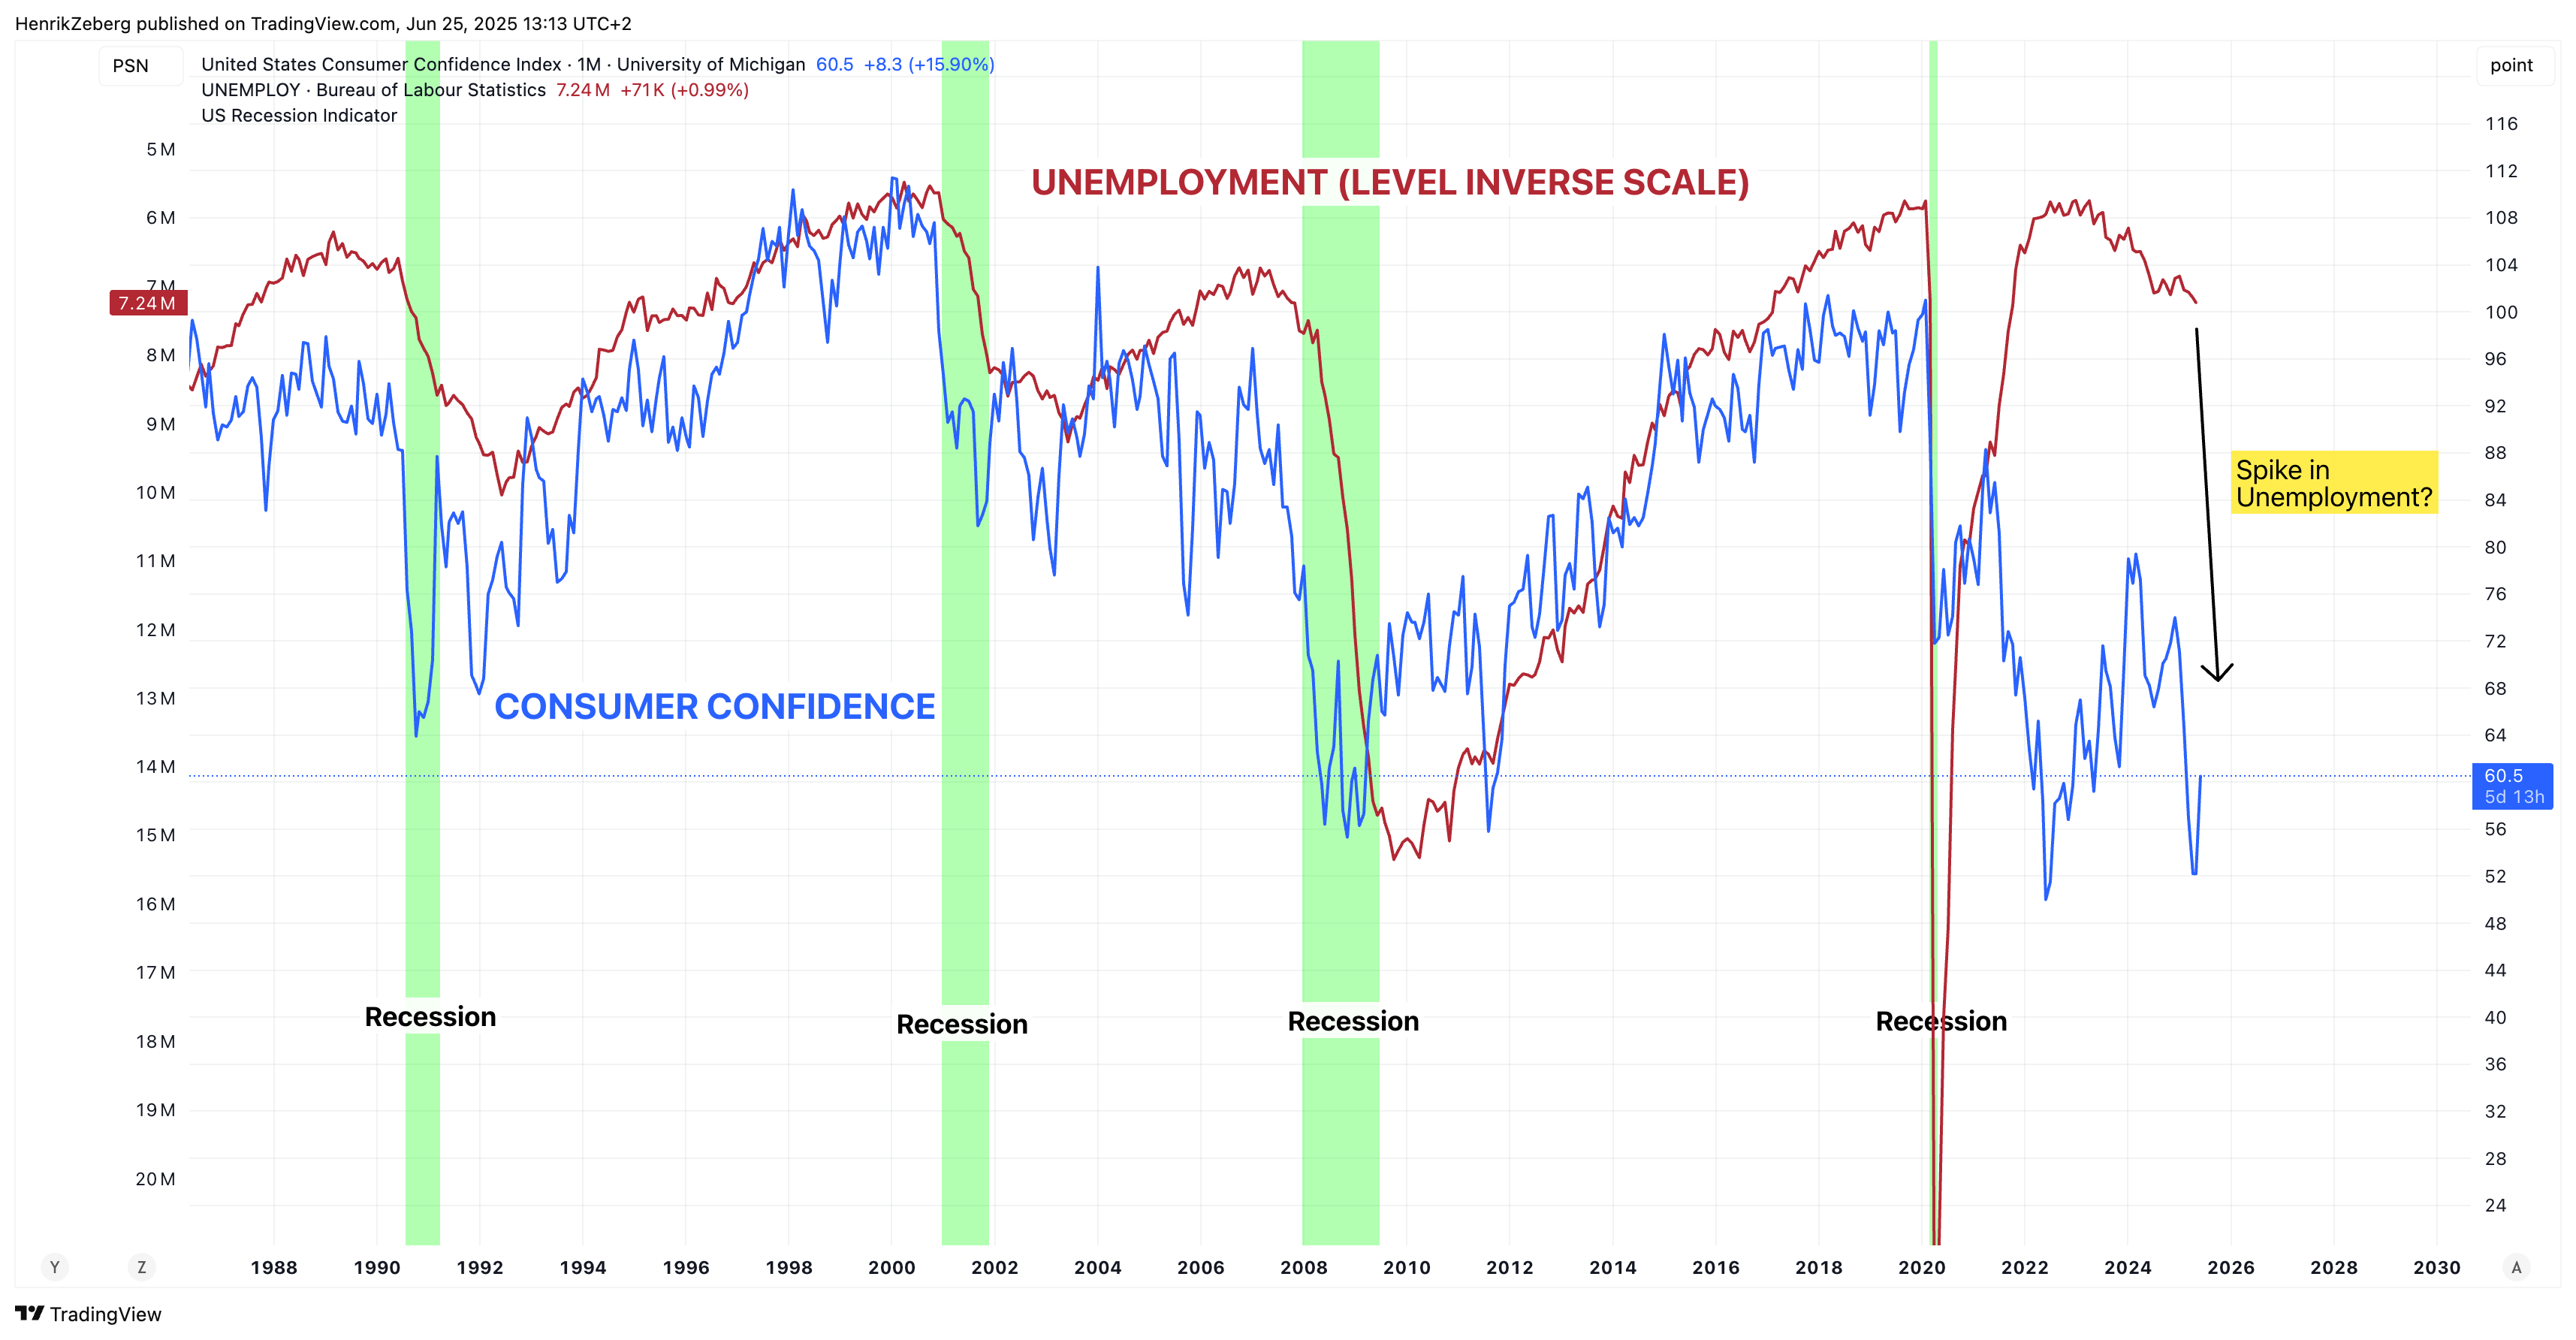
The U.S. Federal Reserve today reminds me of someone looking through the wrong end of a telescope. They see a labor market with low unemployment and think the economy is fine. But they’re missing the fact that the consumer is deteriorating rapidly. Consumer confidence surveys have plunged to levels typically seen during recessions – even though we aren’t officially in one. The chart above tells the story: unemployment (red line, inverted) is near historic lows (meaning joblessness is minimal), yet consumer confidence (blue) recently sank to its weakest in over a decade. This kind of collapse in sentiment, without a current recession, is unprecedented in modern times.
Why does this matter? Because the consumer is the real economy. Roughly 70% of U.S. GDP comes from consumer spending. If households are pessimistic – struggling with high prices, high debts, and eroding savings – they will spend less, and the economy will invariably slow. It appears that surging inflation and borrowing costs over the past two years have inflicted serious damage on consumers’ finances and psyche. Measures of consumer sentiment from the University of Michigan and the Conference Board plunged in 2022-2023 to some of the lowest readings on record (apart from the 2008-09 crisis and the 2020 COVID shock). That is not what you see in a healthy expansion.
Yet the Fed seems laser-focused on coincident indicators like the unemployment rate, while dismissing the clear distress signal from consumers. This is shaping up to be one of the Fed’s largest policy errors ever. As I noted on social media, it’s amazing that the Fed cannot see the devastation hitting the American consumer – they’re “forgetting” about the very engine of the economy. Indeed, debt delinquencies on credit cards, auto loans and mortgages are now surging after years at low levels, another sign the consumer is tapped out. If the Fed ignores these warnings and keeps policy tight (or is too slow to ease), they risk pushing the economy off a cliff. They’ve become so fixated on yesterday’s inflation fight that they are missing today’s recession forming under their noses.
Housing Market Flashing Red – Just Like 2006
U.S. Housing vs. Unemployment: The NAHB Home Builders’ Index (blue) has plunged from its peak, indicating collapsing builder confidence, while unemployment (orange, inverted) sits at lows. Historically, a big drop in housing sentiment foreshadows a jump in unemployment (recessions shaded). “Clock started” – a housing downturn leads the economy.
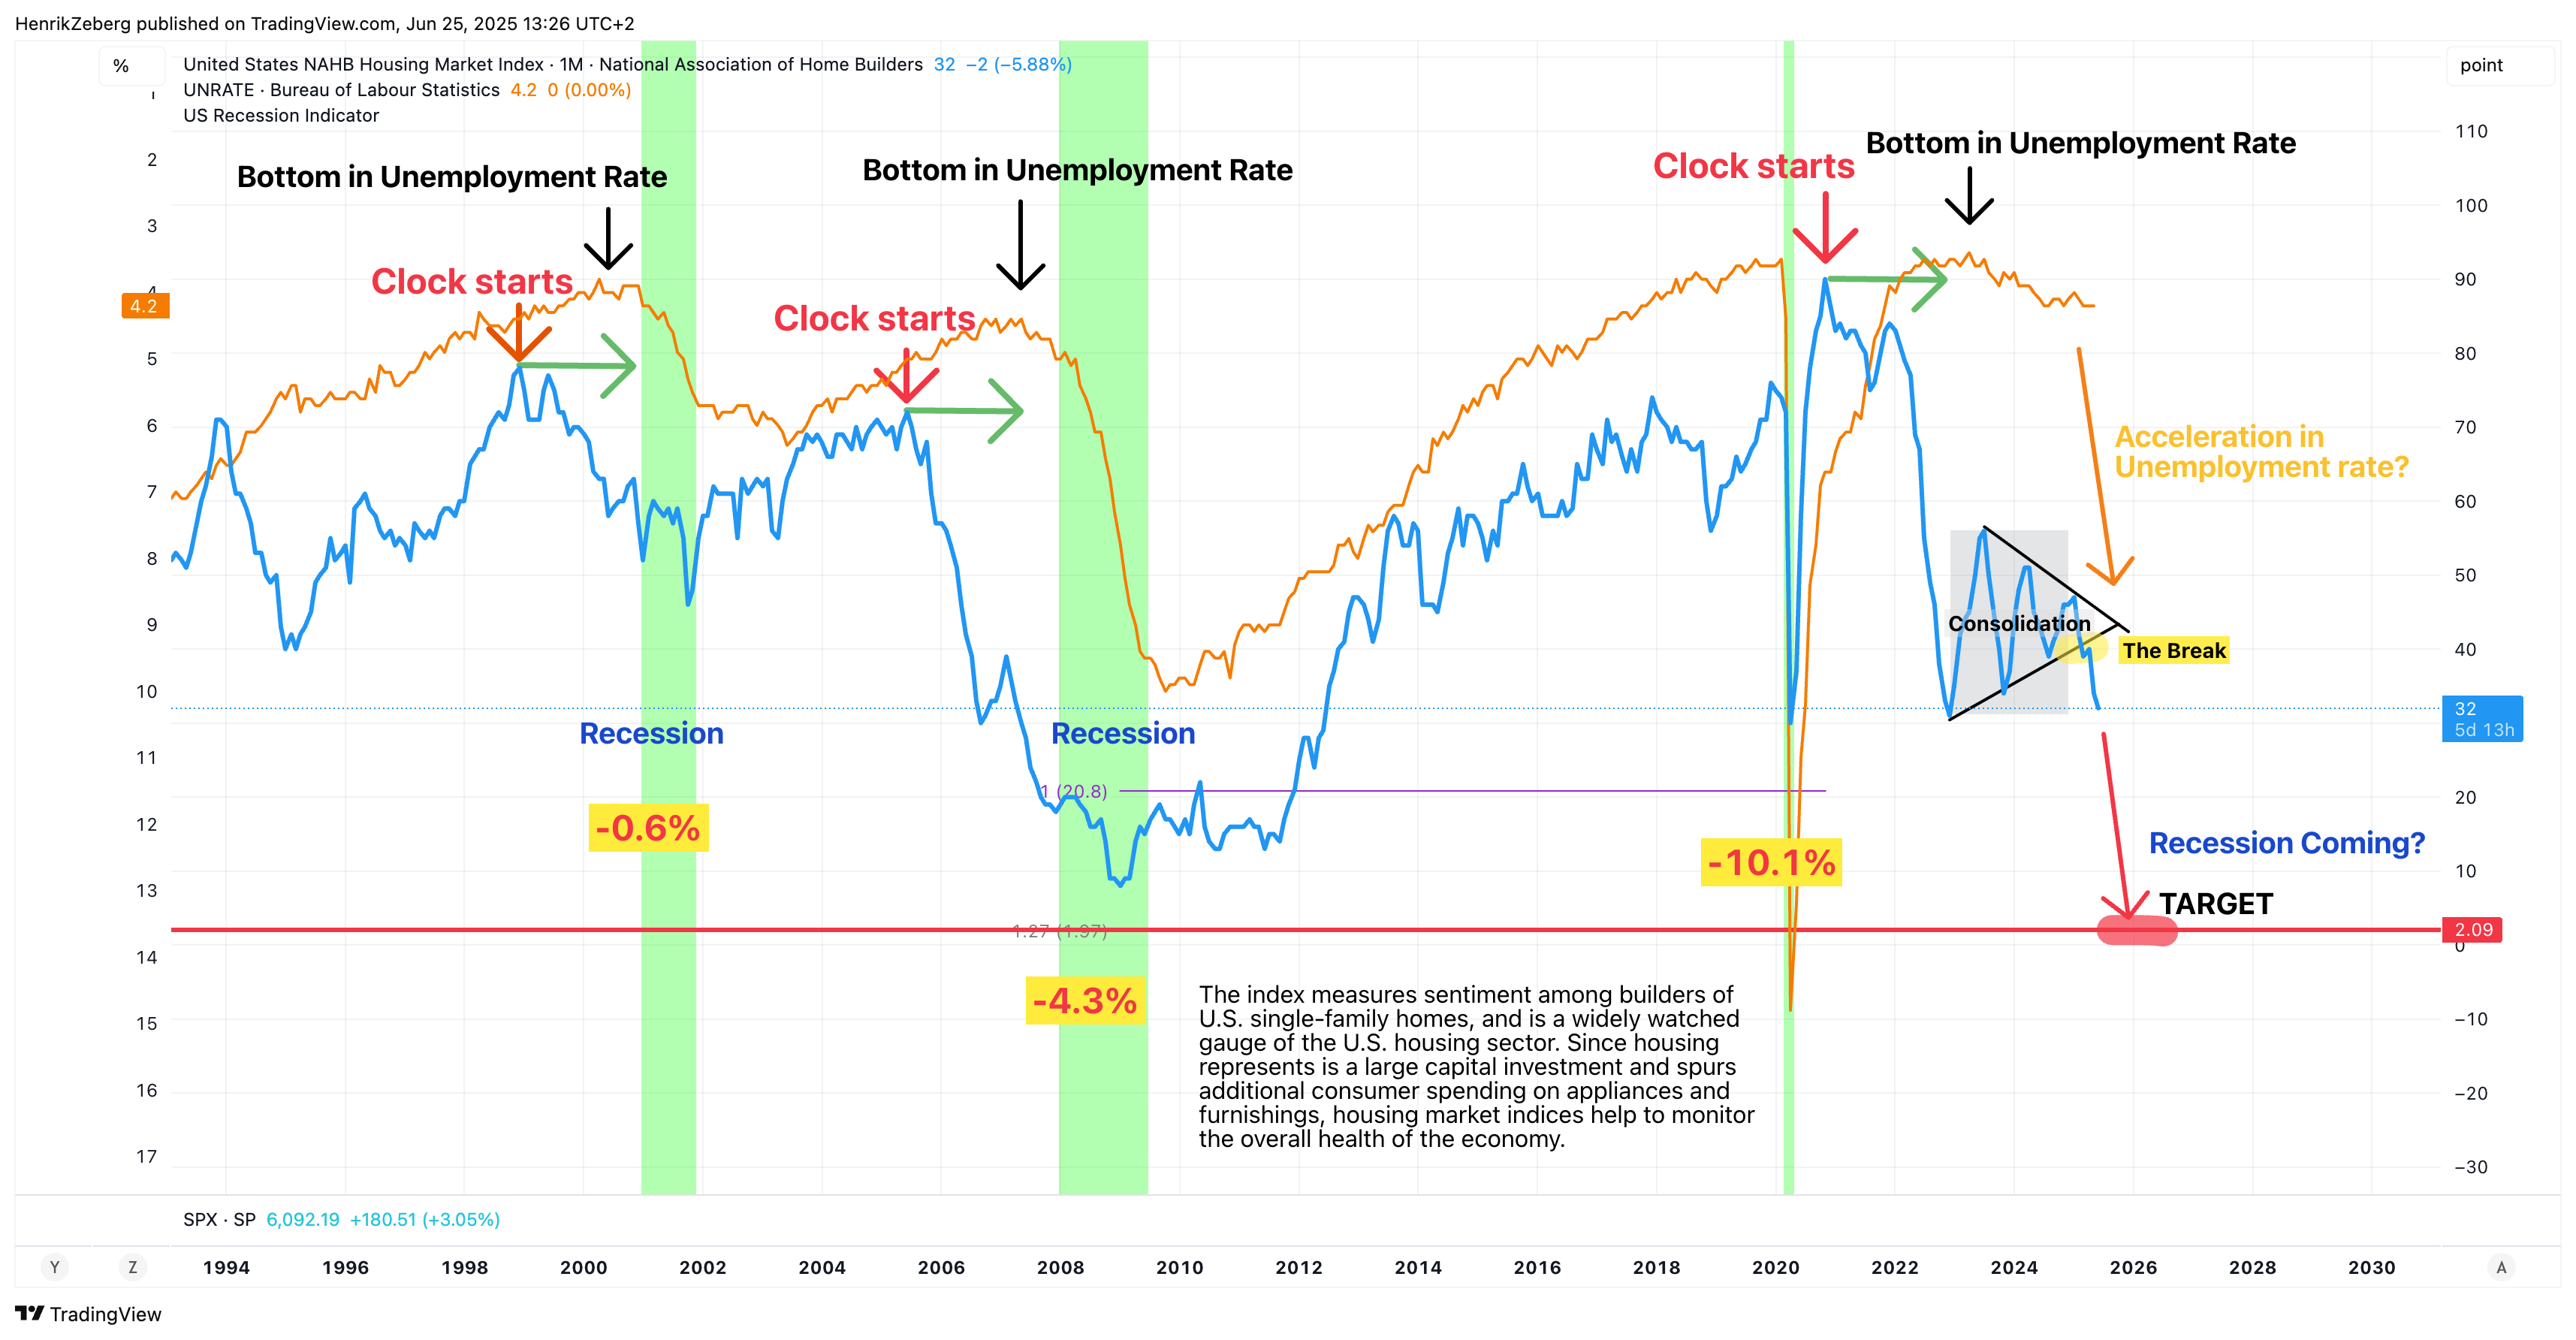
Housing is the most interest-rate-sensitive sector, and it’s often the early canary in the coal mine for the economy. In the mid-2000s, the housing market began cracking well before the broader 2008 crash – homebuilder sentiment turned down by 2006, new home sales fell, and mortgage delinquencies started rising. We’re seeing an ominously similar pattern now.
The NAHB/Wells Fargo Housing Market Index (HMI), a survey of homebuilder confidence, has collapsed from its pandemic boom highs. In June 2025 it registered just 32, which is the third-lowest reading since 2012 (only April 2020 and Dec 2022 were worse). Builders are slashing prices and offering incentives to attract skittish buyers, as high mortgage rates choke affordability. This index was in the 80s in late 2021; a drop to the 30s represents a brutal swing from euphoria to pessimism among builders. Such a sharp decline has always coincided with economic trouble ahead. In fact, every time the NAHB index has dived, the unemployment rate jumped a year or so later – that orange line in the chart tends to surge upward following a big blue-line drop.
Think of it this way: Housing leads the cycle. Building a home is a major investment; when builders get pessimistic (due to plunging buyer traffic, cancellations, etc.), it’s because they see storm clouds gathering. Right now they’re as gloomy as they were in late 2007. Housing permits and starts are down, home sales are weakening – all classic precursors to recession. We ignore the housing market at our peril, because it is loudly warning that a slowdown is here. In 2006-07, many dismissed housing’s decline as “contained” – famously, even the Fed did. We know how that turned out. Today’s housing slump may not involve a subprime implosion, but the impact on growth is similar: fewer construction jobs, less demand for materials, less spending on furnishings, etc. It’s a negative domino effect. The Titanic has a gash in its hull, and housing is where the water is first flooding in.
Labor Market “Strength” – Hiding Cracks Beneath the Surface
U.S. Continuing Jobless Claims (blue, log scale) with recessions shaded. When continuing claims (ongoing unemployment benefit rolls) spike, it’s a “Hard Landing” (recession) every time – except one soft landing in the mid-1990s. Claims have been trending up, raising the question: Hard or soft landing this time?

Everyone points to the low unemployment rate and steady monthly job gains as evidence that the economy is fine. It’s true, the labor market lagged other indicators and remained firm longer than expected. But under the surface, weakness is emerging. One key metric I watch is continuing jobless claims – essentially, the number of people remaining on unemployment benefits (as opposed to initial claims, which are new filings). Continuing claims have risen from around 1.2 million at the cycle’s trough to about 1.95 million recently (bloomberg.com). That’s roughly a 60% increase in the unemployed rolls from the lows. Historically, such an upswing has occurred in the run-up to recessions.
The chart above illustrates that every recession (shaded) was accompanied by a spike in continuing claims – as layoffs mount and unemployed workers take longer to find new jobs. Notably, there was one instance around 1995 where claims ticked up but a recession didn’t occur (often cited as a “soft landing”). But today’s rise in claims is already larger and more sustained than that mid-90s blip. Americans are starting to have a harder time getting re-employed. The momentum of the claims increase (captured by the RSI indicator in purple) is reaching levels that in the past signaled the economy rolling over.
Other labor cracks: job openings (JOLTS) have fallen sharply – from over 11 million openings in 2022 to about 7 million now. Layoff announcements have ticked up in sectors like tech and finance. And wage growth, after running hot, is cooling, which often happens when the job market begins to loosen. The paradox of labor is that it’s a coincident indicator – it stays strong until suddenly it doesn’t. We saw this in 2007: unemployment hit a cycle low of 4.4% in spring 2007, barely months before the recession started. Similarly, unemployment just hit a low of 3.4% in 2023, and has only nudged slightly higher. It will likely spike upward once we enter a recession, catching many by surprise.
So don’t be fooled by headline unemployment. Look at forward-looking labor indicators: continuing claims up, temporary-help employment down, job openings down, quits rate down. The labor market’s foundation is eroding, even if the facade looks intact. When the dam breaks, it breaks suddenly – mass layoffs will emerge after the recession is recognized. In short, the labor market is not as “bulletproof” as it appears. It’s simply the last part of the ship to start sinking.
The Everything Bubble: Stock Valuations in the Stratosphere
The S&P 500 vs. Money Supply (M2) – an era of money-printing fueled euphoria. Key valuation metrics at major market peaks: 1929 (P/E ~32, Market Cap/GDP ~87%), 2000 (P/E ~30, MC/GDP ~137%), 2007 (P/E ~17, MC/GDP ~105%), and 2024/25 (P/E ~30, MC/GDP ~208%!). We are in uncharted bubble territory.

If the real economy is deteriorating, you’d never know it from the stock market. The S&P 500 and other indices have been making record highs, seemingly disconnected from fundamentals. This is the hallmark of a late-stage bubble – “fantasy land” prices driven by liquidity and speculation, not by economic reality. By many measures, we are living through one of the greatest asset bubbles in history – arguably bigger than 1929 or 2000. Consider:
The total U.S. stock market capitalization is now roughly 200% of GDP. (By some estimates it reached ~208% at the 2024 peak.) Warren Buffett famously called this ratio “probably the best single measure” of market valuation – and warned that when it got to ~140% it was “playing with fire.”
Today we’re far beyond that. “Nearly two years ago the ratio rose to an unprecedented level... That should have been a very strong warning signal,” Buffett wrote about the 2000 dot-com bubble. Well, here we are again, at even crazier heights.The S&P’s price-to-earnings (P/E) ratio is back around 30, on par with 1929 and 2000 peaks (those ended disastrously). Other metrics like price-to-sales and cyclically adjusted P/E (CAPE) are at or near record highs as well. By Buffett’s own favorite metric, today’s market is more overvalued than any previous peak. That’s why Buffett’s Berkshire Hathaway has been quietly selling. In fact, Buffett has unloaded tens of billions in stock over the past year, including a chunk of Apple, and built a cash hoard of over $300 billion – an all-time high. Berkshire was a net seller for eight straight quarters through 2024, a clear risk-off stance. As one analyst noted, “Its hoarding cash suggests a ‘risk-off’ mindset” – Buffett is positioning cautiously while the crowd buys with abandon. That should speak volumes.
So how did we get here? In a word: easy money. The chart above shows the S&P 500’s meteoric rise alongside the surge in M2 money supply after 2009. The Great Financial Crisis gave birth to an era of zero rates and quantitative easing (QE), which effectively forced investors out of safe assets and into risk assets. The Fed printed over $8 trillion, and other central banks added trillions more – and a lot of that liquidity flowed into stocks, bonds, real estate, and even crypto. This created a perception of wealth (booming portfolios, home values, etc.), but much of it was an artificial monetary expansion. As Austrian economist Ludwig von Mises presciently observed decades ago:
“There is no means of avoiding the final collapse of a boom brought about by credit expansion. The alternative is only whether the crisis should come sooner as the result of a voluntary abandonment of further credit expansion, or later as a final and total catastrophe of the currency system involved.”
In other words, you can either defuse a credit bubble by deliberately letting markets crash (a controlled burn), or you keep inflating until you risk a currency collapse. Central banks chose the latter path post-2008 – endless stimulus to prop markets up. The result is the Everything Bubble we see now. But gravity cannot be defied forever. The only way out of an unsustainable bubble is through a collapse – either asset prices collapse, or the value of money does (via runaway inflation).
I do not expect the authorities to sit idle and let a full currency collapse happen, which means eventually they will step back in to stabilize markets (more on that later). But first, we are likely to witness a violent asset price reset – a deflationary crash to purge the excess. The S&P 500 soaring 750%+ since 2009, far outpacing GDP or earnings growth, is itself a warning. It’s what Hyman Minsky called “Ponzi finance” dynamics – valuations increasingly supported only by the expectation of further price gains, not fundamental returns. We’ve seen it in meme stocks, in tech startups with no profits, in NFT art selling for millions. It’s the same psychology as every great bubble in history. And like those, it will end abruptly.
Markets vs. Economy: A Dangerous Divergence
Job Openings (blue) vs S&P 500 (red). In past cycles, these moved together (both fell heading into recessions). Today, job openings have plunged from 2022 highs, flagging a weakening economy, while the S&P soars to new highs – a glaring divergence.
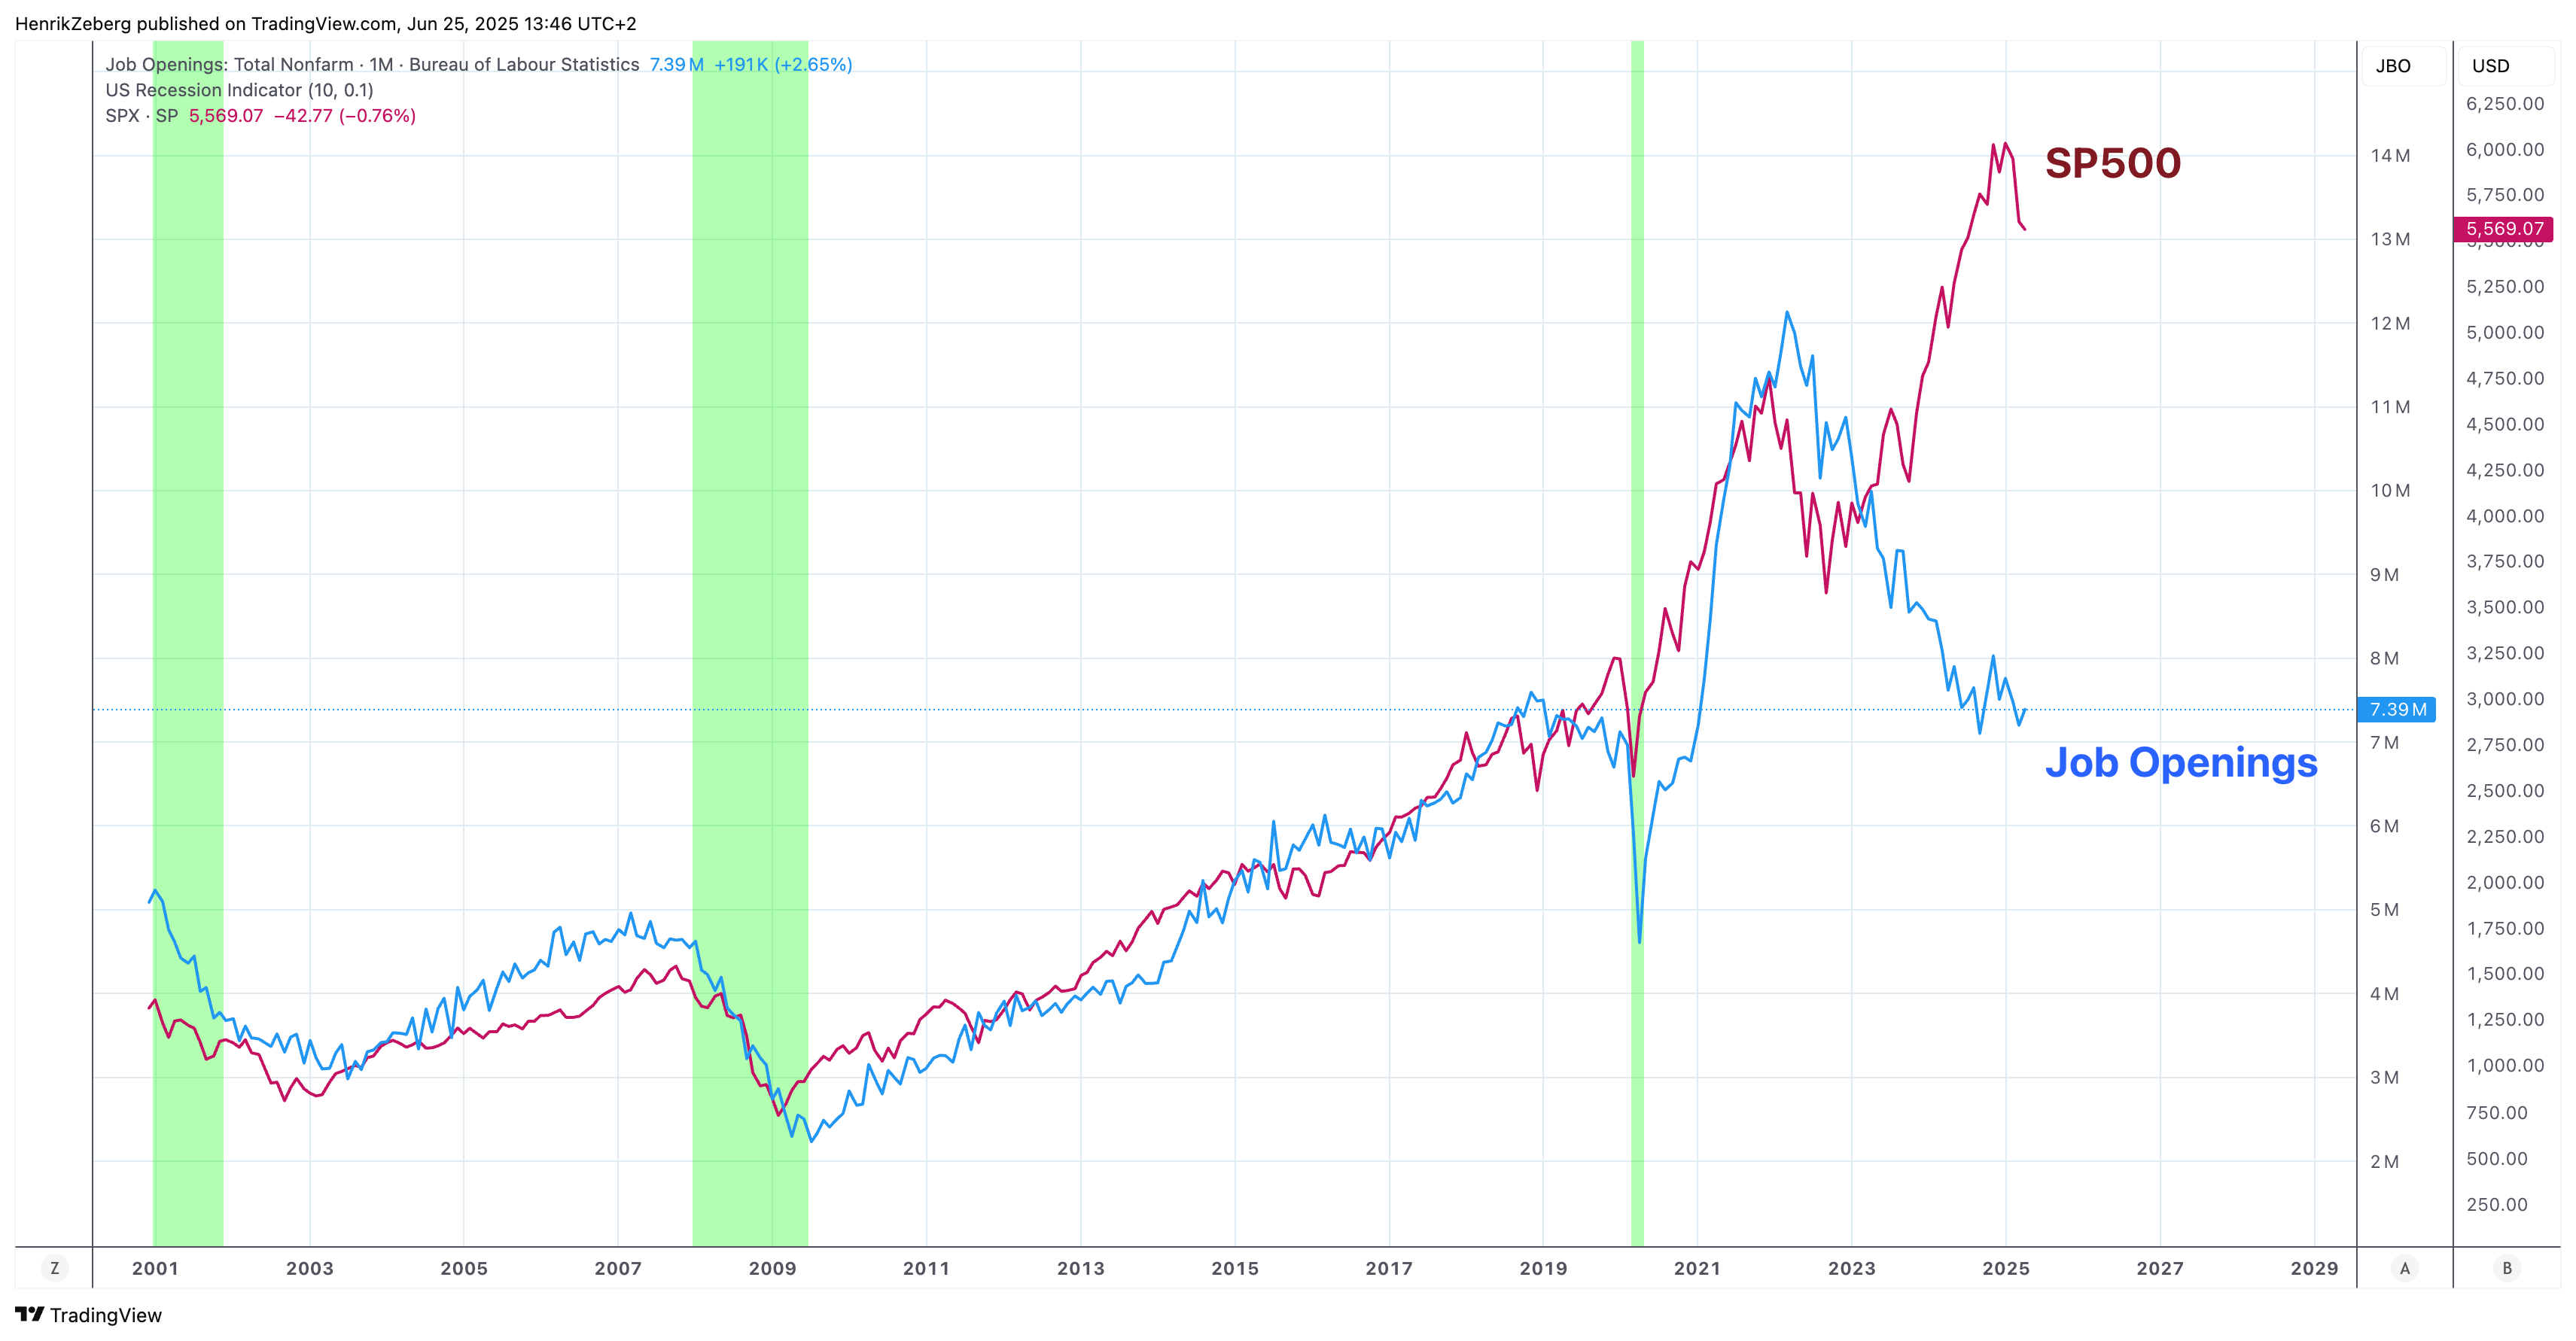
One of the most striking features of this period is how out-of-sync financial markets are with the real economy. We’ve basically got Wall Street in la-la land and Main Street in distress. The chart above is one illustration: U.S. job openings have fallen to their lowest since early 2021 – a sign of cooling labor demand – yet the S&P 500 index is 20%+ higher now than it was then. Normally, if businesses are posting fewer job openings (because they foresee less growth or have hiring freezes), the stock market would anticipate an economic slowdown and cool off. But not this time – stocks have powered upward regardless.
Another illustration: The Philadelphia Fed’s Coincident Economic Activity Index (which aggregates state-level employment, income, and production) has essentially flatlined over the past year, even ticking down recently – indicating the economy’s momentum is stalling.

Yet the S&P 500 has rocketed to record highs. When you plot them, the gap is glaring – I call it the “Mind the Gap”. It’s reminiscent of 1999-2000, or 2007, when equity prices disconnected from underlying fundamentals for a time. We know how those episodes resolved: the market eventually snapped back to reality, hard.
Dow Theory offers another red flag: non-confirmation by the Transportation Index. As of mid-2025, while the Dow Industrials and S&P hit new highs, the Dow Jones Transportation Average (which tracks shipping, railroads, air freight, etc.) has lagged badly – it’s been stagnant, nowhere near new highs.
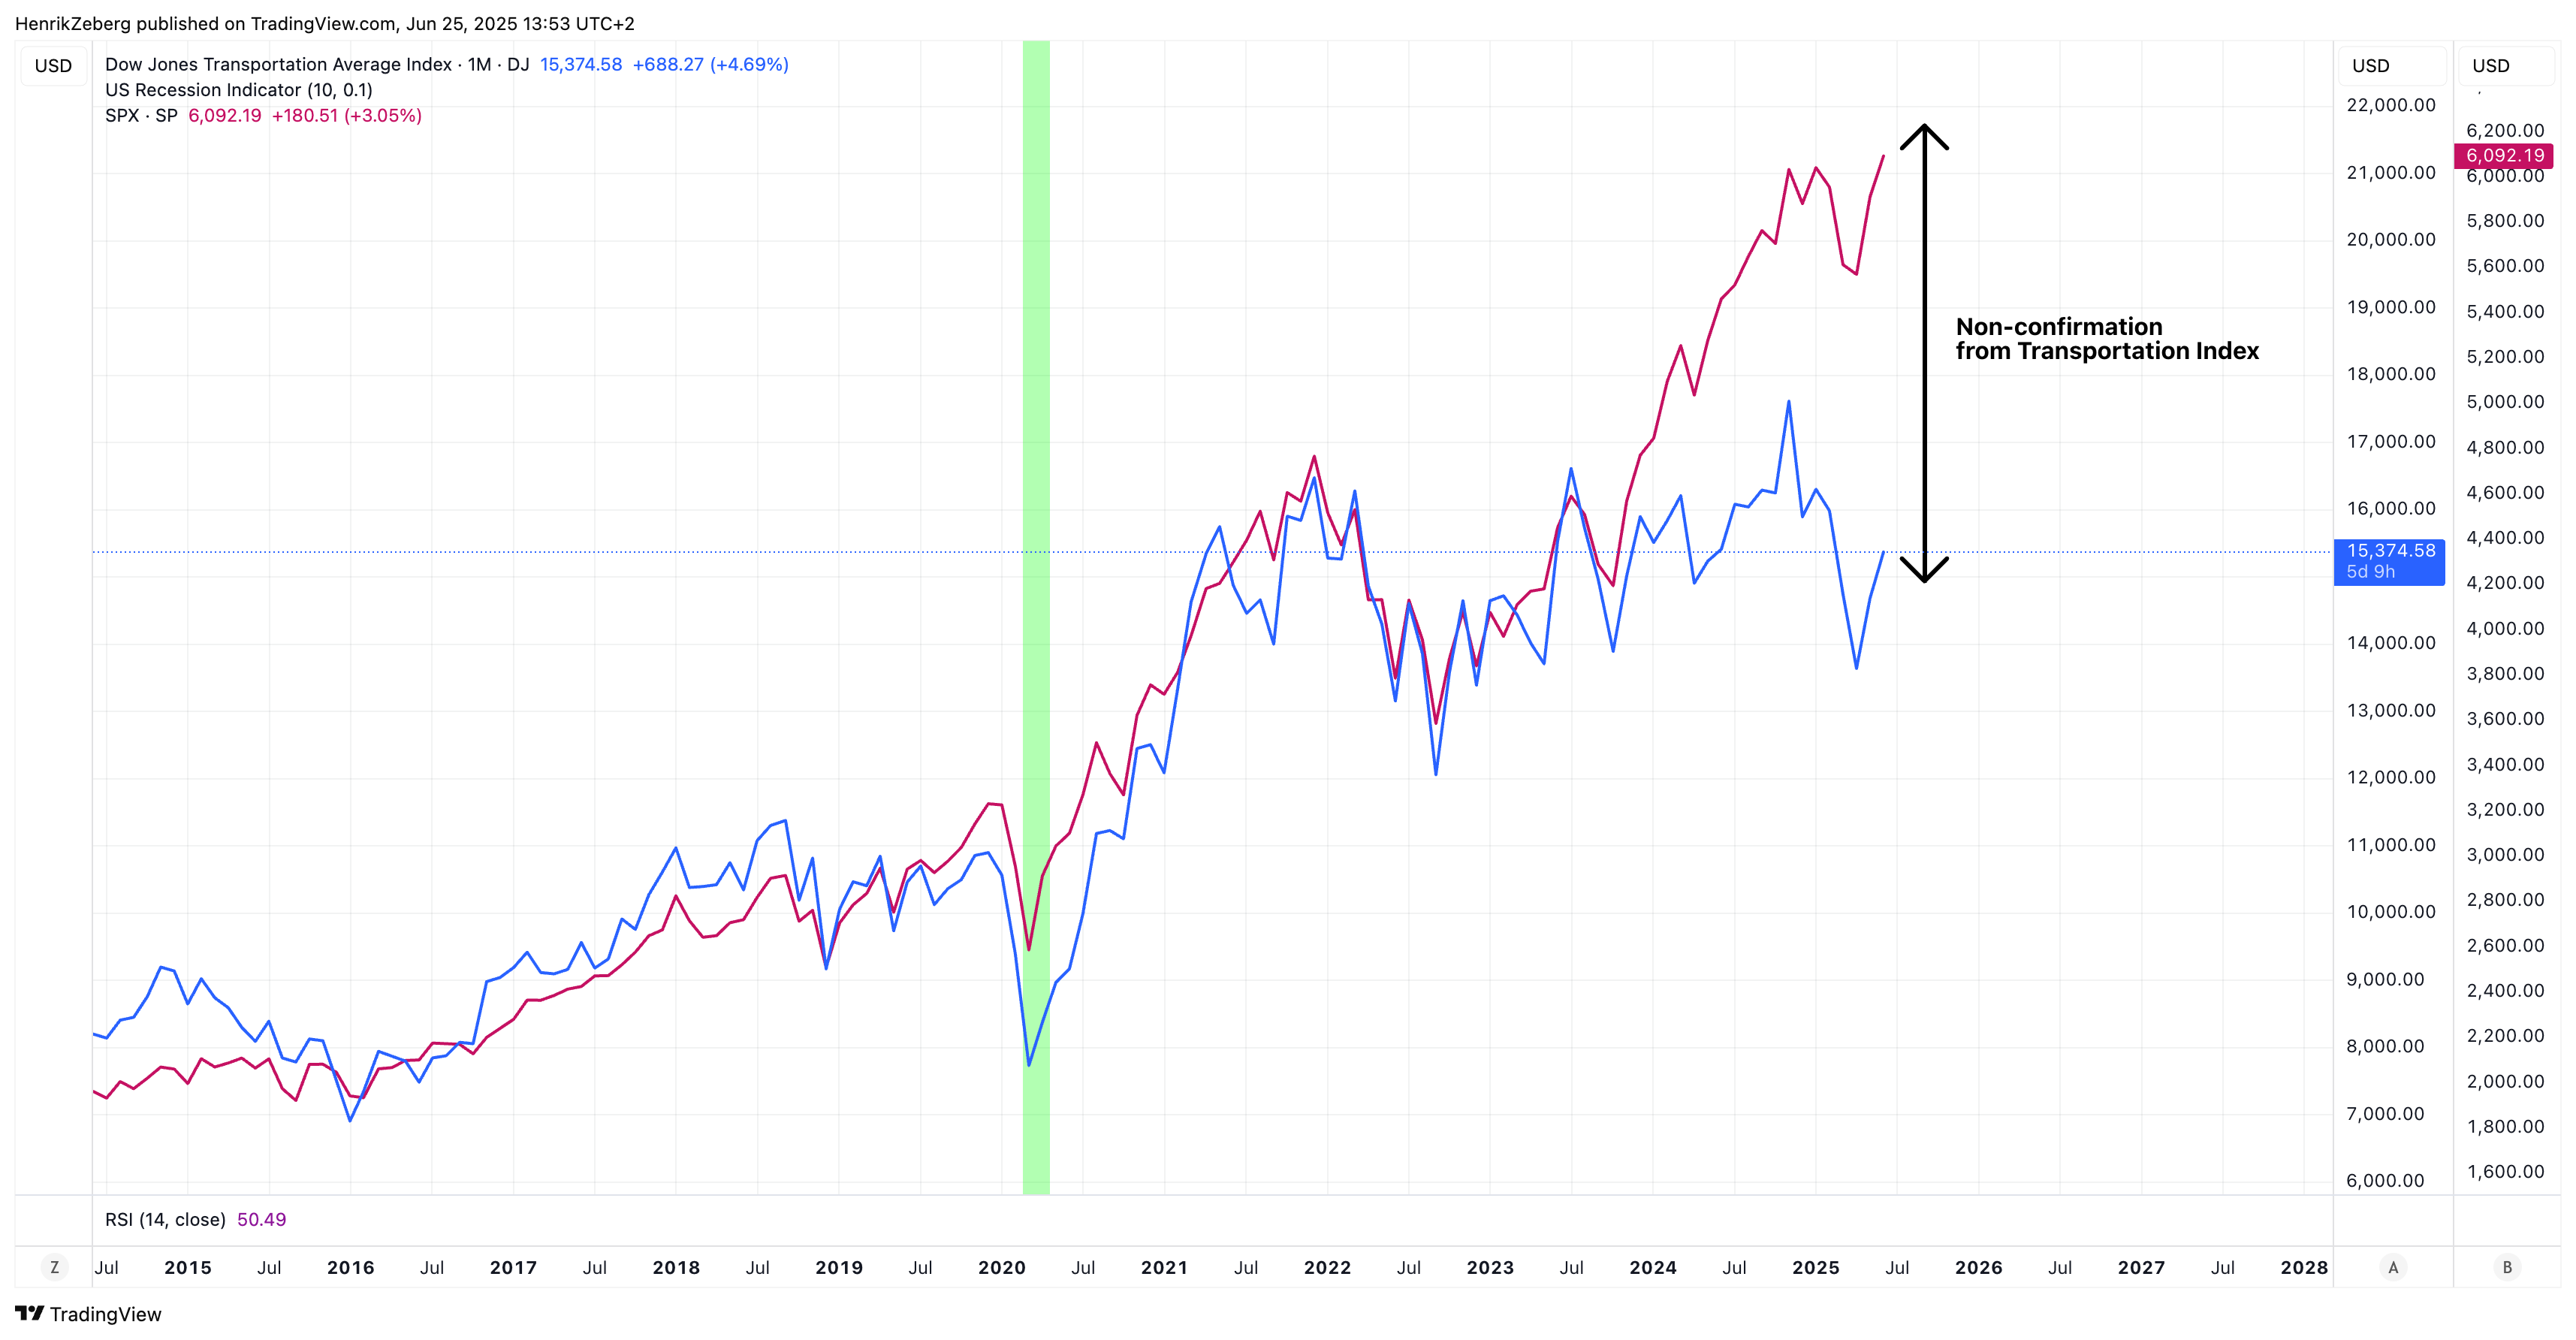
In fact, the divergence between the Dow and Transports hit extremes not seen in over 25 years. Why does this matter? Because if the economy were truly booming (justifying record stock prices), the companies that move goods around (trucks, trains, etc.) should also be thriving. Their slump tells us something is off. Historically, such divergences often precede market downturns, as they did in 1999 and 2007. It’s an ominous signal that the stock market’s strength is on shaky ground.
In sum, financial asset prices are foreshadowing a utopia that the real economy cannot deliver. This kind of divergence never lasts indefinitely. Either the economy re-accelerates miraculously (unlikely, given all the leading data we’ve discussed), or asset prices will eventually reconcile with economic gravity (i.e., fall). My money is on the latter. The longer the market stays disconnected, the more violent the eventual snap-back could be. It’s a coiled spring. As I warned, “the market is not an efficient machine” in the short run – it can overshoot far beyond fundamentals, as it is now, but that only sets up a bigger crash when reality returns.
Crypto: The Poster Child of Speculation (This Cycle’s “Subprime”?)
The speculative excess of the past few years is perhaps nowhere more evident than in cryptocurrency. I say this as a market observer who isn’t inherently anti-crypto (blockchain technology has its merits) – but let’s call a spade a spade: the crypto market in 2021-2024 was a frenzy of Greater Fool speculation. We saw utterly worthless meme coins – tokens literally created as jokes – soar to multi-billion dollar market caps. Dogecoin, which started as a parody with an infinite supply and no development, at one point hit about $88 billion in value – larger than the market cap of FedEx or Dell. Another meme coin, Shiba Inu (inspired by Doge), briefly flipped Dogecoin and reached a similar valuation. And there have been thousands of copycat “animal coins,” “food coins,” etc., collectively attracting tens of billions of real dollars. As one report dryly noted, by late 2024 over $140 billion was “stashed in cryptocurrencies that don’t pretend to have any utility”(coindesk.com).
If that isn’t the definition of a bubble, I don’t know what is. It’s reminiscent of the subprime CDO mania of 2006 – lots of complex, opaque securities being traded at high values with little understanding of the true risk. Back then, the toxic assets were junk mortgages; today, one could argue a lot of crypto tokens are the toxic assets of this cycle (highly volatile, no intrinsic value, held largely for speculative purposes). The difference is when subprime blew up, it directly hit the banking system. When crypto blows up – and it has been collapsing for retail investors (many coins down 90%+ from highs) – the systemic ties are fewer, but not non-existent. We’ve already seen crypto-related blowups cause real damage: major crypto lenders and hedge funds imploded in 2022, and even some banks (like Silvergate and Signature) failed partly due to crypto-related deposit runs.
I suspect the crypto market will not be spared in the coming reckoning – in fact, it may crash even harder as liquidity dries up. The “greater fools” will vanish. Many of these meme coins will go to zero, just as 90% of dot-com stocks did in 2000. The broader significance is psychological and indirect: the crypto mania exemplified the speculative fever of this era. When it breaks, it will sap a lot of remaining risk appetite. Moreover, there could be knock-on effects – for instance, if Bitcoin itself plunges 80% (as it has in past bear markets), what happens to entities that concentrated in it? Which brings me to a specific concern: Bitcoin’s newfound institutional embrace.
Bitcoin: Widely Embraced, Wildly Volatile – A Risk to Corporate Balance Sheets
Bitcoin, the king of crypto, has undergone a transformation in perception. It started as an experiment, then a fringe hobby, and in the last few years became almost a “must-have” asset for many. We saw not only retail investors, but companies and even countries jumping on the bandwagon. Corporate treasuries like MicroStrategy (and for a time, Tesla) bought billions in Bitcoin; El Salvador adopted it as legal tender and holds a treasury of BTC; countless hedge funds and even some pension funds dabbled in crypto. The rationale was that Bitcoin is “digital gold” and an inflation hedge, etc. But let’s be clear: Bitcoin remains an extremely volatile speculative asset. It has crashed on the order of -80% multiple times in the past decade. It provides no cash flow, no intrinsic yield – its value is purely what the next buyer will pay.
This sets up a dangerous scenario. What happens if Bitcoin plunges from, say, $150k to $30k (an 80% drop) during the coming financial crisis? For one, MicroStrategy – which has over 150,000 BTC on its balance sheet – would see its asset base wiped out. The company has even taken on debt to buy Bitcoin. An 80% price collapse could render it insolvent or force massive write-downs. MicroStrategy’s stock would crash, and its creditors might face losses. Could that spark a domino effect? Potentially – for example, if a major lender to MicroStrategy (or other crypto-backed firms) had to mark down assets, it might strain their capital. We don’t know the interconnections fully, but we do know that crypto losses have a way of surfacing in unexpected places (just as subprime losses unexpectedly toppled certain money-market funds in 2008).
Even beyond MicroStrategy, consider all the retail and institutional money that poured into Bitcoin and crypto near the top. If Bitcoin tanks, consumer wealth is hit (maybe less spending, more defaults), some institutional portfolios take a hit, and confidence in all risk assets could suffer a blow. Bitcoin has been treated as a risk-on asset lately – it tends to rise and fall with speculative appetite. In a financial crisis, it’s likely to crash along with equities (as it did in March 2020). The twist this time is that it’s much more mainstream and entangled with conventional finance than before. We even have Bitcoin ETFs on the horizon that would further interlink it with traditional markets. This is not to pick on Bitcoin per se – it may well have a long-term role – but to underscore that its near-term implosion could act as a catalyst or amplifier in a broader market crash.
I often ask: if Bitcoin did drop 80%+, who would be the Bear Stearns of crypto? We saw some previews (FTX’s collapse, etc.), but on the corporate side, MicroStrategy is the obvious one – essentially a leveraged Bitcoin holding company masquerading as a software firm. I have even publicly mused that one day I will “short the s***” out of MicroStrategy – not yet, but when the time is right. That time may come soon after the market topping process completes. And when a high-profile name like that starts unraveling, it could seriously dent market sentiment. In short, Bitcoin’s widespread adoption into big portfolios is a new vulnerability. It has introduced a potential “non-linear” element to the coming crisis.
Technical Warnings from the Charts: Topping Signals Everywhere
At this point, even the technical analysis is screaming that we are near a major market inflection. I know not everyone cares for charts, but when you see multi-year extremes and divergences on high time frames, you should pay attention. Let’s start with the stock market’s chart:
S&P 500 Index (Monthly): Prices have pushed to new highs (~6100+) in 2025, but the RSI momentum indicator (bottom) is making lower highs – a massive bearish divergence last seen before major tops. The MACD is also flattening at a high level. This kind of multi-month divergence is a classic topping signature.

On a monthly chart of the S&P 500, we are witnessing a rare bearish divergence – the index made a higher high, but key momentum indicators (like RSI and MACD) made lower highs. This indicates weakening internal strength even as price stretches upward. The last time we had negative divergences of this magnitude on the monthly timeframe was 2007 (and before that 1999-2000). We all know what followed those instances. In addition, the market’s advance has narrowed – the rally is being led by a handful of mega-cap tech stocks, while many other stocks lag. That’s another hallmark of a late-stage rally (a classic “last gasp” where breadth deteriorates).
From an Elliott Wave/frothy sentiment perspective, we could be completing a final “blow-off” wave higher. In fact, my analysis has been calling for a minimum target around 6800 on the S&P 500 for this blow-off top. We are not there yet, which is partly why I believe the absolute peak is still a bit ahead (perhaps in the coming weeks or months). But we are very close. Upside from here is likely limited, and downside risk is exponential once the top is in. As I said, I expect most people won’t realize it’s the top – it won’t be obvious until after it’s passed. That’s why I’m shouting from the rooftops now.
The crypto charts similarly show a developing peak pattern. Look at Bitcoin:
Bitcoin (BTC/USD, Weekly): Bitcoin is on track for a potential final parabolic rise (targeting $150K+), but the weekly RSI is already showing negative divergence (lower highs) as price motors higher. Prior peaks in 2017 and 2021 were marked by such divergences. A final wave up into Q3/Q4 2025 could complete a massive bull cycle – and then… watch out.
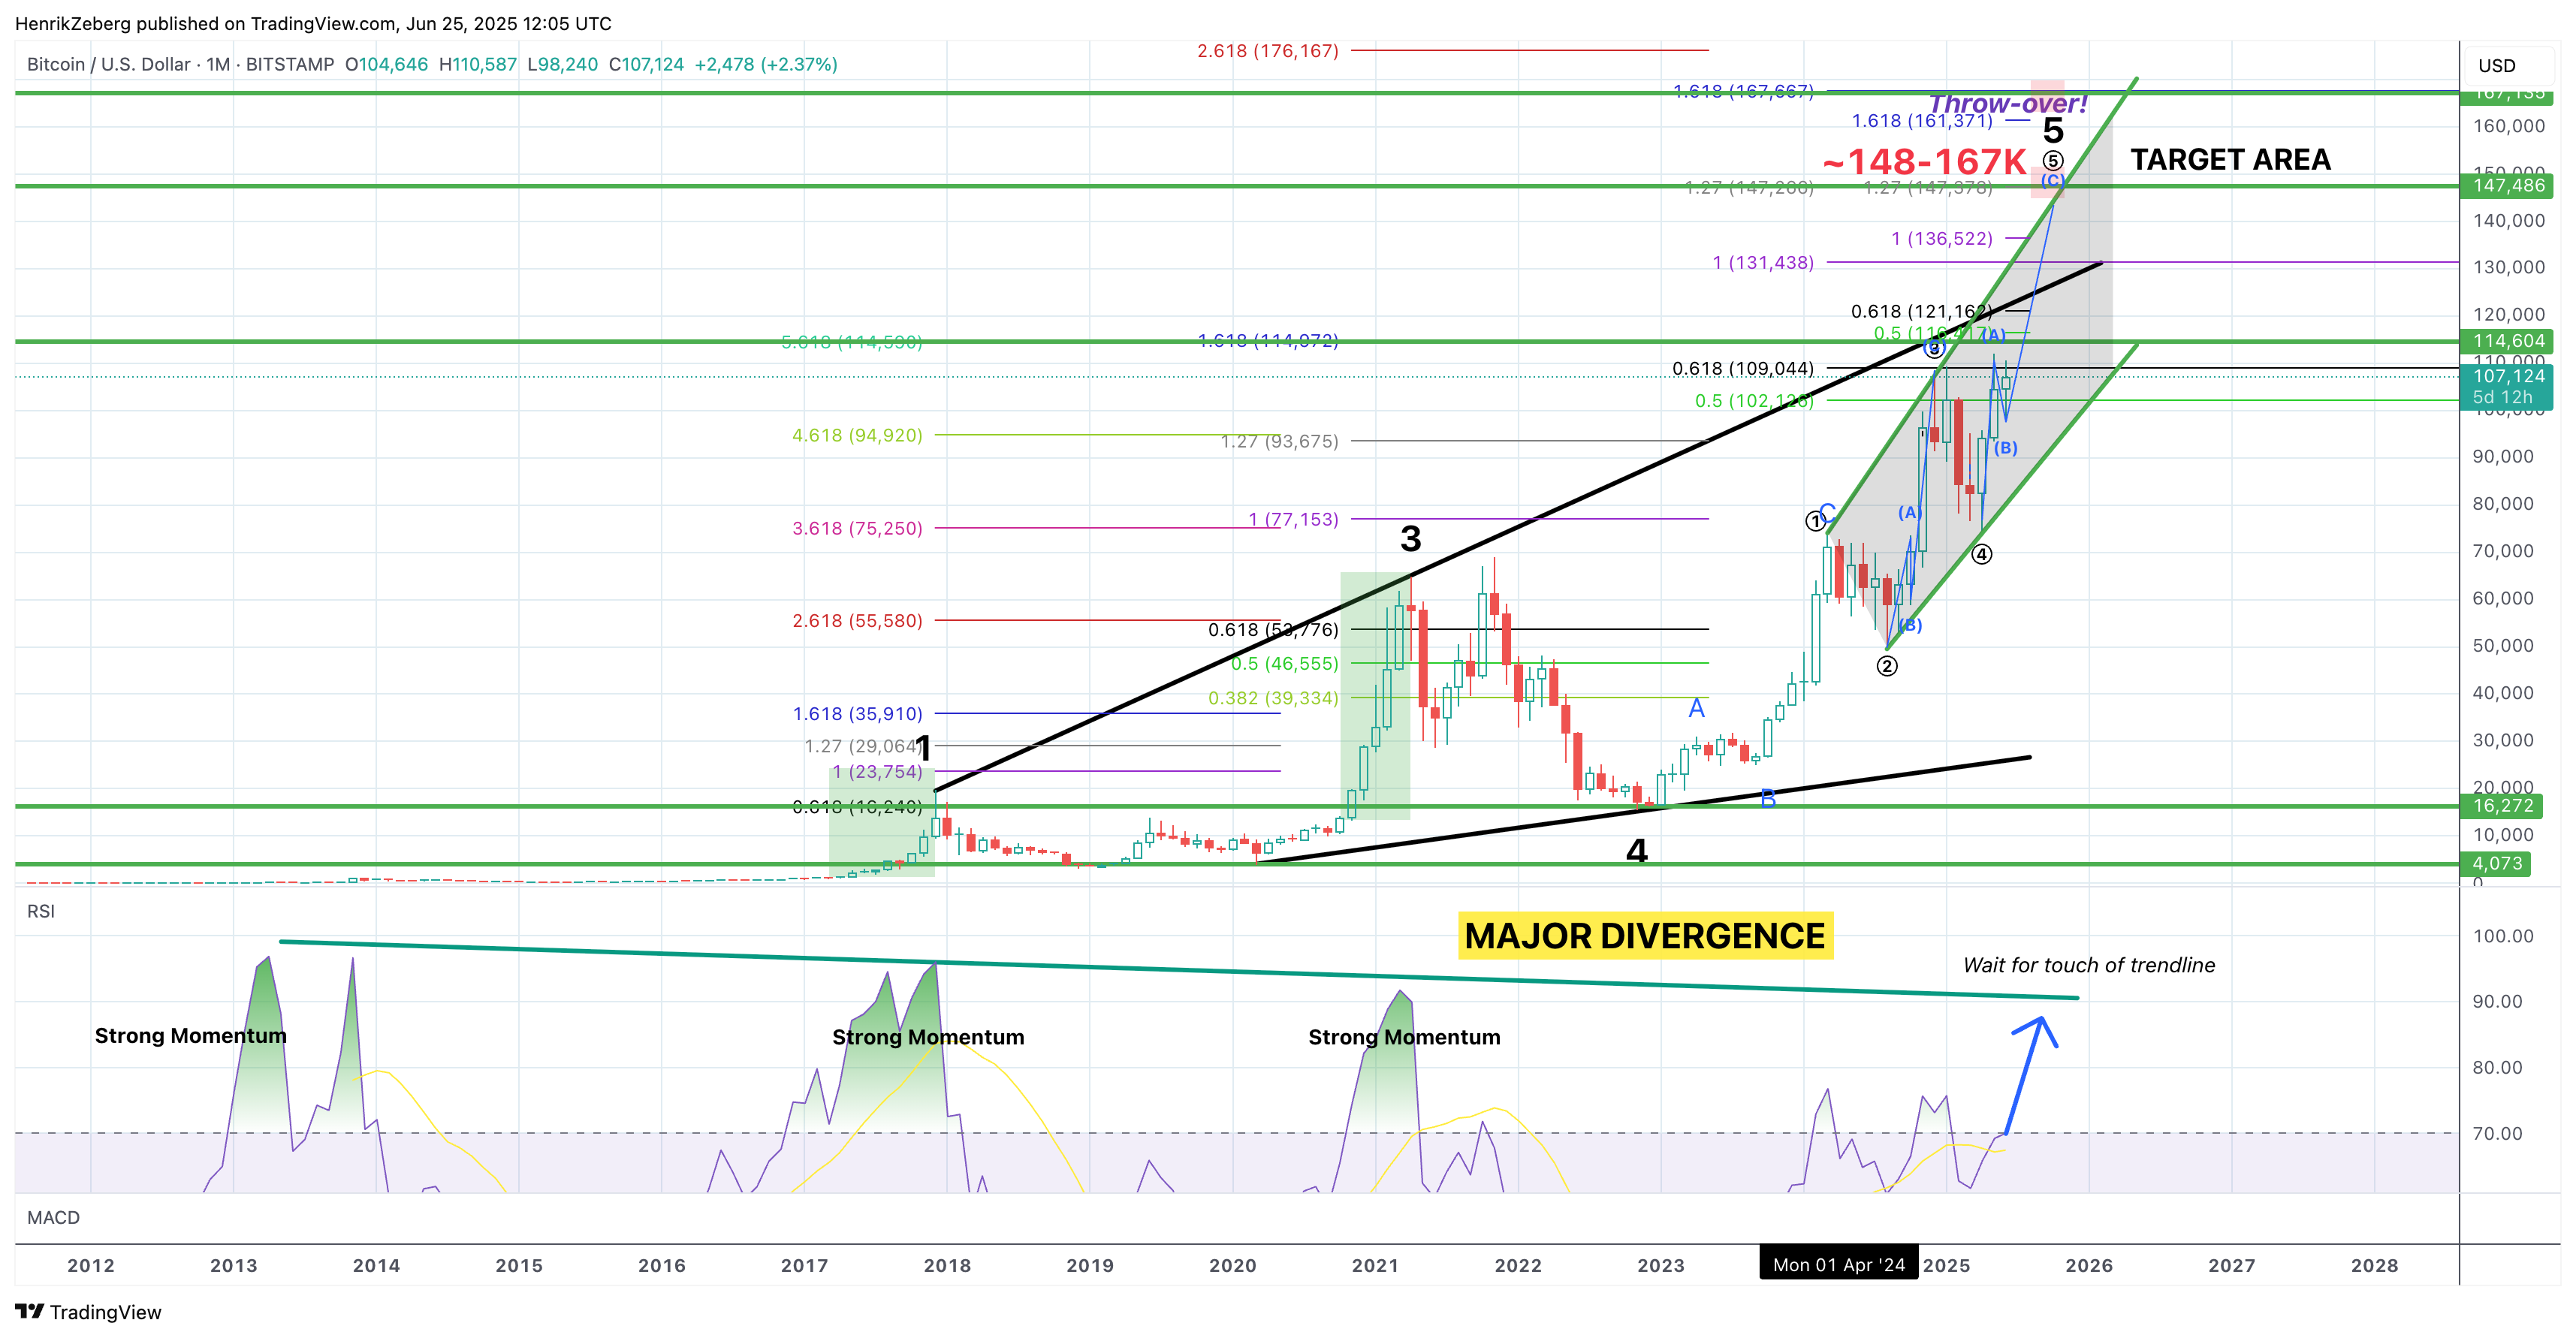
Bitcoin’s weekly and even monthly indicators are flashing warning signs. Each thrust higher is on diminishing relative strength. We’ve seen this movie before: in late 2017, Bitcoin’s price went vertical to nearly $20k, but RSI diverged – and a brutal bear market followed. Again in 2021, Bitcoin hit $65k with huge divergence and promptly halved in price in weeks. Now we are potentially in the final speculative surge – I would not even be surprised if BTC hits $150K or more at the cycle peak (perhaps around the time S&P tops at 6800+). That would represent a frenzied run – and likely suck in the last remaining bulls (“this is going to the moon forever!”). But the technicals suggest it would be unsustainable and ripe for reversal. Extreme greed always appears near tops. We’re already seeing signs of that in crypto again – new meme coins surging, people bragging about gains, etc. It’s the final euphoria.
This is why I call this piece a Final Warning. The charts are effectively blaring sirens that a trend change is near. Could the S&P go a bit above 6800? Sure, perhaps it overshoots to 7000. Could Bitcoin overshoot to $200k? In a mania, anything is possible. But chasing the last 5-10% higher is a fool’s game when downside of 50%+ is in play after. My strategy has been to ride the bull run with one foot out the door, and I’m getting both feet ready to sprint out. I hope others do the same. Remember, no one will ring a bell. You must heed the subtle (and not-so-subtle) clues for yourself.
Even Warren Buffett Smells Trouble
It’s worth reiterating the significance of what some “smart money” players are doing. Warren Buffett – famed for his long-term optimism and usually a net buyer of stocks – has been selling and hoarding cash at an unprecedented pace. In 2024, Berkshire Hathaway dumped over $130 billion in equities and doubled its cash reserves to more than $320 billion. Buffett trimmed big stakes like Apple and Bank of America and even paused his beloved buybacks. He’s effectively battening down the hatches. In Buffett’s view, valuations have become so extreme that future returns likely won’t justify the risk – or worse, a major downturn could be coming. He once analogized high market cap-to-GDP readings to “playing with fire,” and he’s clearly not playing now.
Buffett’s favored valuation yardstick (market cap/GDP) is flashing red, as discussed, and he’s positioning accordingly. To me, this adds credence to the idea that we are on the cusp of a significant market top. When the most celebrated value investor of all time is effectively saying “thanks, I’ll sit this out (with a mountain of cash)”, perhaps the rest of us should question the all-in exuberance that’s running rampant. It’s like seeing the casino’s owner quietly exit the building while the patrons are doubling their bets – a subtle but powerful warning.
I mention Buffett not because he’s infallible, but because his actions align with the data we’ve analyzed. Extreme valuations, deteriorating fundamentals, massive speculative excess – it’s the recipe for a crash. Buffett’s not trying to time the top to the day, but he clearly wants to be well clear of the exit before the rush starts. We should all think hard about doing the same.
Potential Triggers: What Could “Pop” the Bubble? (Don’t Wait for a Catalyst)
Many ask, “Yes, but what will cause the crash?” In 2008, people in hindsight point to Lehman or subprime mortgages as the catalyst. In 2000, maybe the Pets.com failures or rate hikes. Here’s my take: Recessions themselves cause the so-called triggers, not the other way around. Once an economy rolls over into contraction, it’s like a pressure drop that reveals all the weak points – and then something “blows up.” In 2007, the stock market actually peaked in October, before any big bank failed. The recession officially began Dec 2007, and it wasn’t until March 2008 that Bear Stearns collapsed, and Sept 2008 when Lehman did. Those were effects of the recessionary environment, which had already been set in motion by fundamental imbalances.
So, I’m not waiting for a specific black swan to call the top. The titanic has hit the iceberg (leading index down) – the cause is in place (a broad economic downturn due to high rates, debt saturation, etc.). That said, we can certainly speculate on likely crisis flashpoints:
Major Bank or Financial Institution Failures: We got a taste in early 2023 with regional banks failing. In a severe recession, defaults could spike and some bigger institutions with heavy exposure to risky loans could topple. Watch for stress in European banks or shadow banks as well. My model and analysis of financial stocks (XLF) suggested that the financial sector has likely peaked (or is close to) and is set to deteriorate. Treasury Secretary Yellen famously said in 2017 she didn’t expect another financial crisis “in our lifetimes” – that optimism may soon be tragically disproven.
Corporate Debt & “Zombie” Companies: Years of low interest rates spawned many overleveraged companies that can barely cover interest payments (so-called zombies). In a downturn, a wave of corporate defaults could occur, especially in sectors like commercial real estate (think office property landlords with high vacancies) or highly leveraged tech/media firms. A large default or series of defaults could spook credit markets and cascade.
Sovereign Debt or Currency Crisis: Outside the U.S., there are emerging markets and even developed countries with shaky finances. Italy’s debt, for instance, or some highly dollar-indebted emerging economies – they could face a bond crisis. A sovereign default (or fear of one) can send shockwaves through banks and global markets. Even the U.S. itself isn’t immune in the long run – though a U.S. debt crisis would more likely show up as a dollar crisis (inflation) rather than outright default.
Geopolitical Shocks: War or geopolitical conflict is always a wild card. We’ve had Ukraine War - and most recently the Israel-Iran War, where the US participated in bombing. Any major escalation involving superpowers could trigger a risk-off panic. That said, it’s unknowable, and I don’t predicate my forecast on an external war shock. The recession will come regardless, but a geopolitical event could certainly amplify a market selloff or be a convenient “blame” for what is really a cyclical downturn.
“Something in Crypto”: As discussed, a high-profile crypto collapse could act as a trigger. If, say, Bitcoin suddenly dives and a known institution suffers huge losses or a crypto exchange fails at a bad time, it could add to panic. It might not cause the recession, but it could mark the moment sentiment cracks.
It’s critical to note: we may not need a singular catalyst. Sometimes crashes happen simply because sellers overwhelm buyers as sentiment flips. It could start quietly – a dip that feeds on itself, margin calls, then a liquidity air-pocket. The 1987 crash, for example, had no single fundamental trigger – it was largely technical and sentiment-driven (portfolio insurance dynamics). With today’s highly computerized and interconnected markets, once a selloff reaches a critical mass, it can accelerate rapidly. We saw a mini-version in March 2020 when stocks fell 35% in weeks on pandemic fears.
So my advice: don’t sit around waiting for “what’s the trigger?” If all the preconditions for a crash are in place (they are!), and you can see the iceberg already struck, positioning accordingly is wise. By the time the newspapers assign a cause to the crash, it will be well underway. Black swans emerge because the system is weak – and our system is very weak right now due to excessive debt, overvaluation, and policy errors.
After the Crash: Deflation First…Then Stagflation?
Ironically, the end of this Everything Bubble could mark the beginning of a very different paradigm. In the immediate aftermath of the market crash and likely global recession, I expect a deflationary shock. Asset prices will plummet, credit will seize up, and demand will crater – just like late 2008 or early 1930s. In that phase, deflationary forces dominate (falling asset prices, possibly outright price deflation in the economy as spending contracts). Central banks will, of course, respond with whatever arsenal they have left – rate cuts to zero (or negative), more quantitative easing, liquidity programs, fiscal stimulus from governments, you name it. They will essentially attempt to re-float the Titanic.
But here’s the key: this time might be different in terms of what those policies achieve. My concern (and forecast) is that once the dust settles, we could transition into a stagflationary regime – the opposite of the 2010s playbook. Why? Because I believe we have already seen the end of the 40-year “Great Disinflation.” The Inverse Volcker Moment has occurred. By that I mean: in 2020, faced with a pandemic supply shock, the Fed and peers did the polar opposite of Paul Volcker’s 1980 approach – they printed money like mad and fiscal authorities sprayed money at consumers. The result? Inflation, of course. We awakened the inflationary dragon that had been dormant since the early 1980s.
Look at the chart below, which shows the US 10-year Treasury yield over more than a century:
US 10-Year Treasury Yield over 100+ years. It highlights alternating inflationary (rising yield) regimes and deflationary (falling yield) regimes. After 1982, yields fell in a secular downtrend (deflationary era) for 40 years. But around 2020-2021, a new inflationary uptrend was born – yields spiked off historic lows, breaking the long downtrend. A new secular inflation cycle appears to be starting, though a deflationary dip may come first.
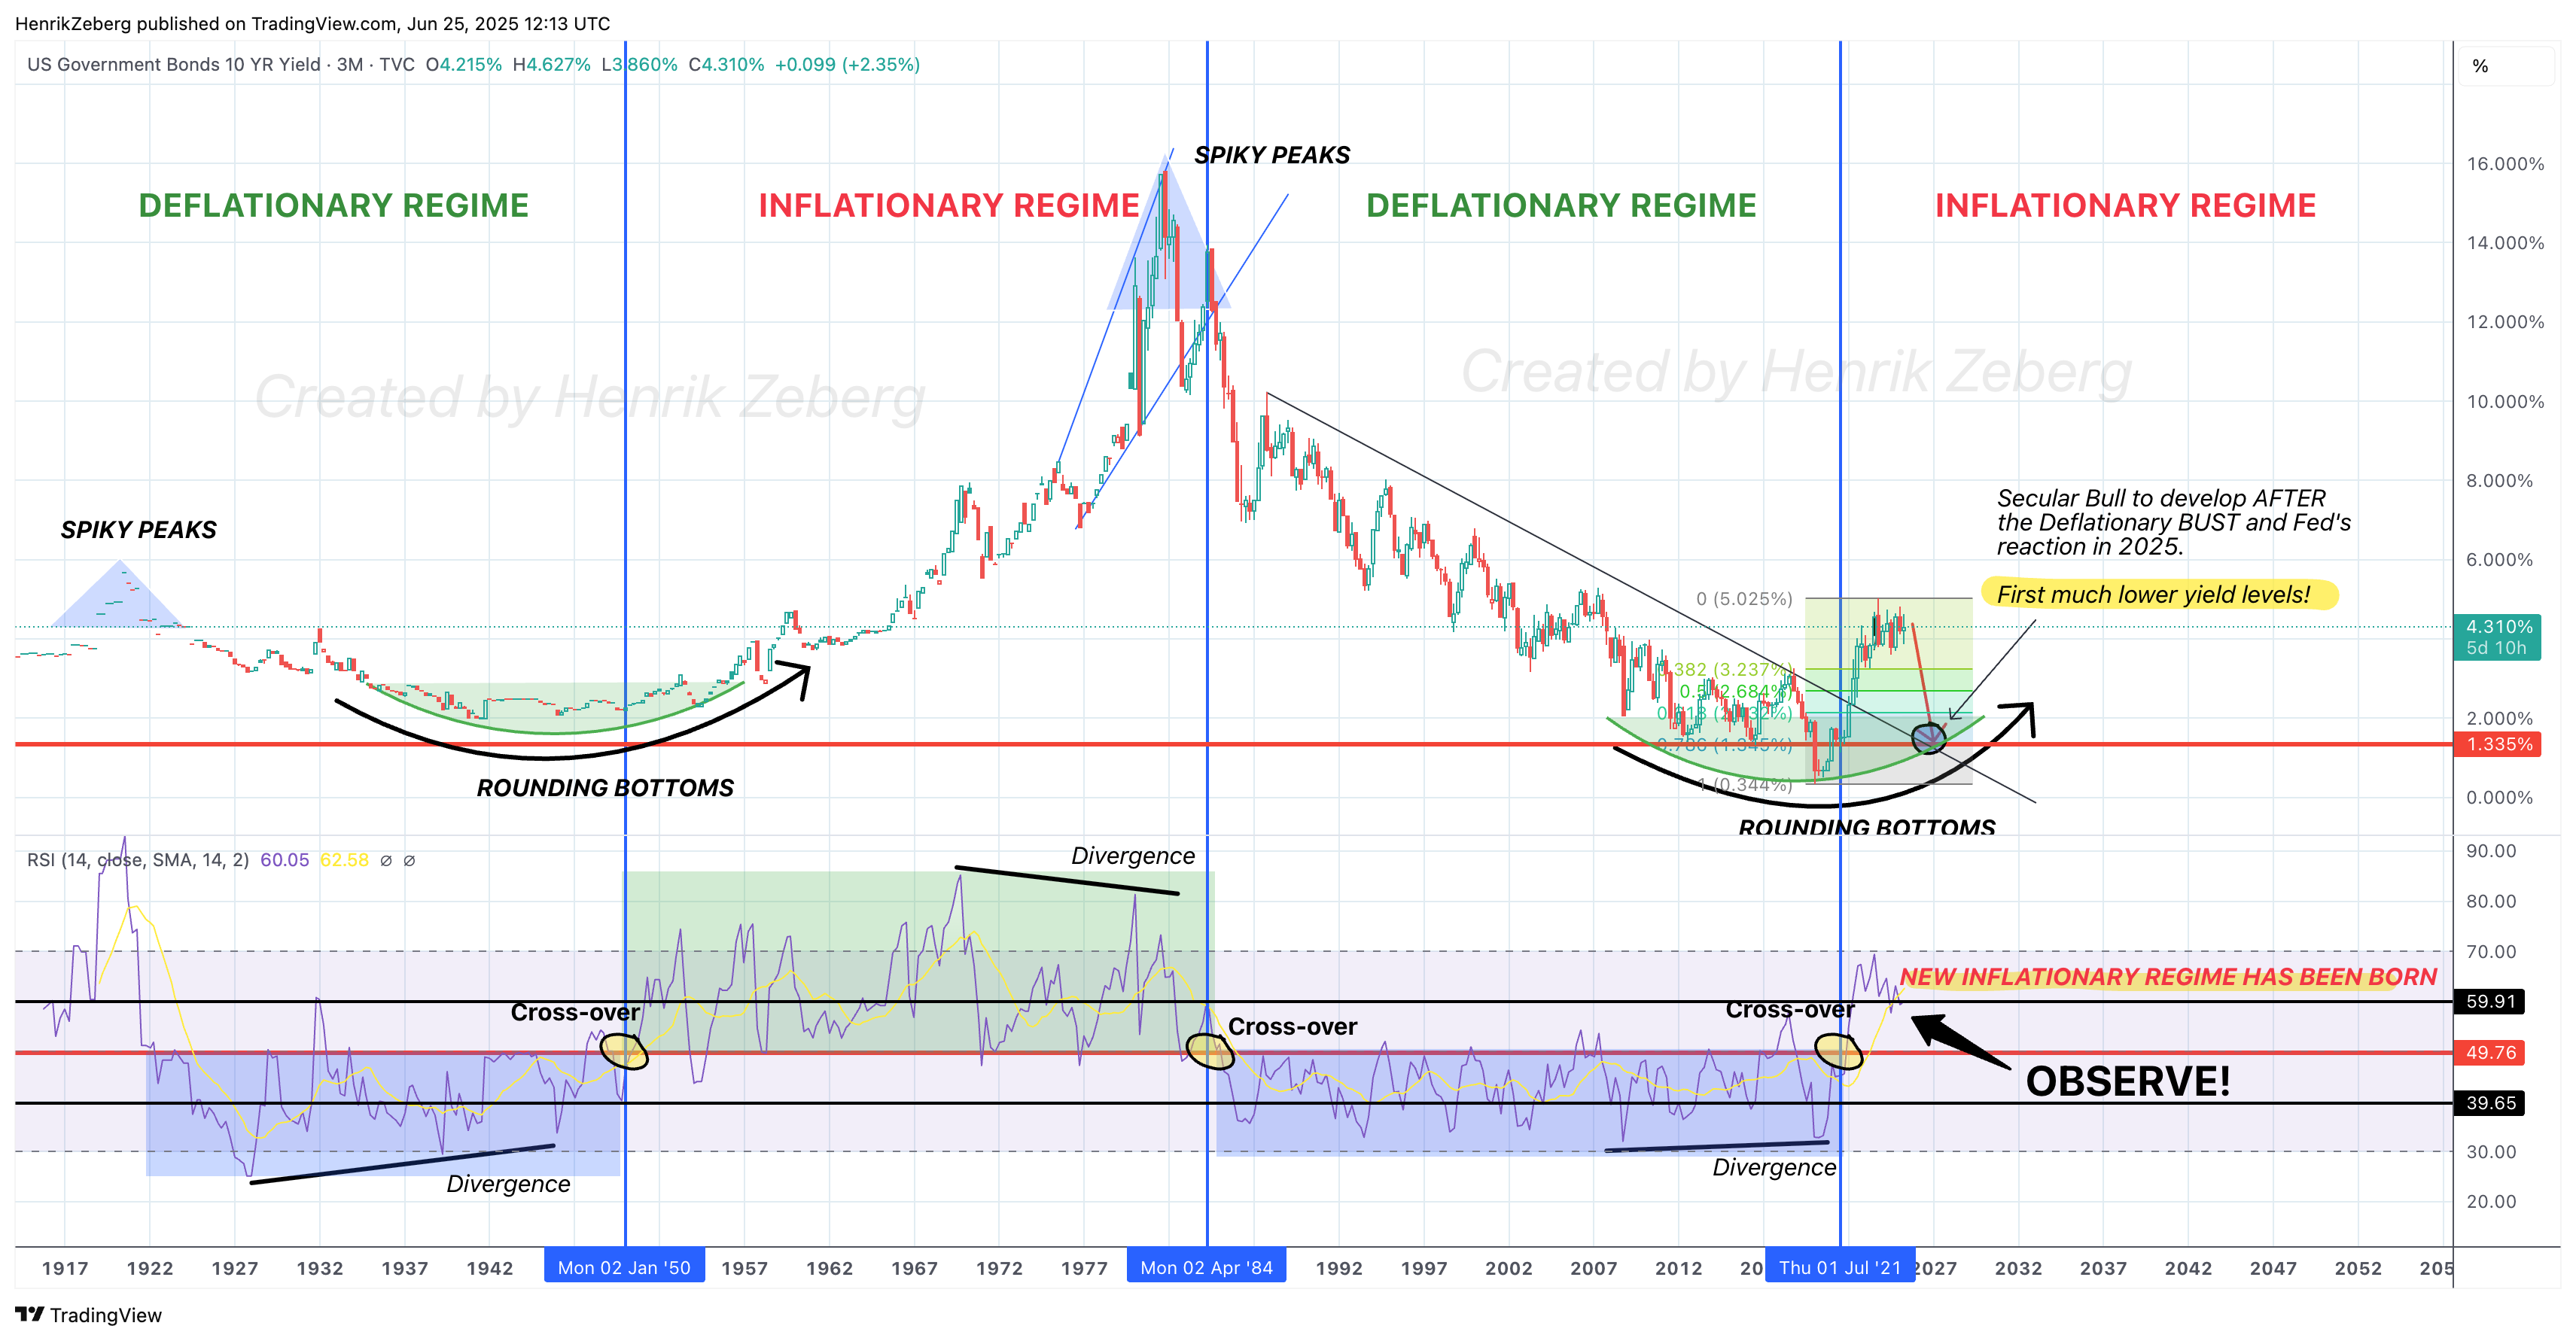
The chart suggests that the period from ~1982 to 2020 was a secular disinflationary era – yields went from ~15% to under 1%, punctuated by lower highs on each cycle. That era allowed central banks to do massive QE without igniting consumer price inflation – the excess liquidity mostly inflated assets, not wages or goods. However, 2020 marked a regime change. Yields have broken out of their channel and surged; inflation hit 40-year highs in 2022. It appears a new secular inflation era may be upon us. Now, in the short term, a severe recession will likely pull yields down again (flight to safety in bonds, and collapsing demand easing price pressures). So I expect a deflationary wave as the crisis hits – perhaps 10-year yields back to, say, 1-2% in the depths of the bust, and central banks slashing rates aggressively.
But then comes the aftermath. The Fed and government will almost certainly overreact with stimulus – it’s all they know. Unlike 2009-2019, when such stimulus did not trigger broad inflation (because the velocity of money was low, banks sat on reserves, etc.), this time it likely will. Why? Coming out of this crash, we’ll have some differences: many supply-side constraints (deglobalization, commodity underinvestment, etc.), governments already running huge deficits (money already being pumped directly into spending), and importantly, the public’s inflation psychology altered after the recent bout of inflation. If the Fed floods the system with trillions again to “save” markets, but supply can’t respond (factories closed, supply chains broken, labor force shrinking, etc.), the result could be stagflation – i.e. stagnant growth + rising prices.
In essence, the next cycle might look more like the 1970s: repeated attempts to stimulate meet a swift inflationary response, forcing policy tightening, which chokes growth – rinse and repeat. It could be a very volatile period. Deflationary bust, then inflationary boom (but weak real growth), then possibly another bust – a roller coaster rather than the relatively stable 2010s. For investors, this means the playbook of “just buy the dip, the Fed has your back” may not work as expected. The Fed may indeed step in to cut rates and print money during the bust (they will be “too late,” as my model suggests, but when they do, they might not get a smooth V-shaped recovery this time – they might just get stagflation (a brief recovery with rapidly returning inflation).
To put it simply: The coming crisis is likely deflationary at first (asset prices and perhaps CPI will drop). Then the reaction – the largest monetary and fiscal stimulus barrage in history, I suspect – will collide with a world no longer in secular stagnation but in supply-constrained, post-globalization mode. The outcome is inflation, even as the real economy struggles to fully recover. That’s the nightmare of stagflation. It’s not immediate – it’s the second chapter of this saga, after the crash. But it’s crucial to be aware of. The 2020s will not be a repeat of the 2010s tranquility. We’ve entered a new macro regime.
In concrete terms, if we see S&P 500 collapse 60%+ and unemployment soar (a depression-like scenario), the Fed and Congress will throw everything at it – zero rates, yield curve control, stimulus checks, you name it. They may succeed in stopping the bleeding, but at the cost of un-anchoring inflation expectations again. And next time, it could be even harder to rein in. Think of a world where unemployment is 8% (not fully recovered) but inflation is also 5-6% and rising. That’s a very ugly policy dilemma – and it’s one I fear we’ll face around 2026-2028 as a consequence of the “solution” to the coming crash.
Conclusion: The Emperor Has No Clothes – Take Cover Before the Crowd Notices
In Hans Christian Andersen’s tale, it took a child to finally shout that the Emperor was parading naked. In our modern economic saga, I suppose I am playing that child’s role – hollering that this “wonderful” economy and bull market is, in fact, exposed and fragile. We have an illusion of prosperity built on debt, printed money, and denial. Beneath, the economic engine is stalling out – the consumer exhausted, housing slumping, factories slowing, debts unpayable without ever-lower rates. The stock market’s gleam is blinding many to the dark storm clouds massing on the horizon.
To recap the key points (the “new clothes” that aren’t really there):
Business Cycle Iceberg: The leading economic indicators have cratered; a recession in 2025 is almost certain by historical standards. We’re past the point of no return (hit the iceberg); the question is only how fast the ship sinks.
Fed’s Folly: Policy is asleep at the wheel, obsessing over lagging employment data while the consumer – 70% of the economy – drowns. This will go down as a huge mistake in hindsight.
Housing & Labor Cracks: Housing’s collapse ensures a broader downturn; the labor market is showing late-cycle deterioration (rising claims, falling openings) even as the headline numbers fool observers.
Bubble of Bubbles: By valuation, we are in the biggest stock market bubble ever. The only comparable periods saw 50-80% market declines. This one likely will too. Money-printing levitated assets, but that air is now escaping.
Speculative Excess: From meme stocks to meme coins, speculation went wild. Crypto exemplified it – tens of billions into joke tokens. That speculative fever is a sign of a market top. It’s not different this time; it’s the same song, new instruments.
Divergences: Markets and the economy have never been this divergent for this long. It’s unsustainable. Either the market is wrong (my view) or we discovered a magic money tree (we didn’t).
Technical Peaks: The charts indicate a topping process. We’re likely in the final blow-off rally. I’ve been on record expecting ~6800 on S&P and ~$150k BTC as potential upside targets – we’re close. The risk/reward now is heavily skewed to the downside once those levels are met.
Buffett and others act: When even eternal optimists quietly head for the exit (Buffett selling, insiders cashing out stock options, etc.), take note. They see the writing on the wall.
Aftermath will be tough: The crisis will probably be followed by aggressive rescue efforts that could kick off a stagflationary era. This is not a simple boom-bust-recovery; it might be boom-bust-inflationary bust.
If you’ve read this far, you might feel overwhelmed – but also, hopefully, aware. A great unraveling likely lies directly ahead. I cannot tell you the exact day or week the market will peak and reverse – no one can. But the weight of evidence suggests we are extremely close to that point in time. This article is my attempt to document the warnings before the fact (so no one can say “no one saw this coming”). It is also a call to action: protect yourself. That could mean reducing equity exposure, raising cash, hedging positions, ensuring your job/finances can weather a recession, etc. In markets, it might be time to rotate from greed to caution – before everyone else tries to all at once. As I quipped in one interview, when fear finally hits, “everyone can’t get out the door at the same time”. The exits get crowded fast in a panic.
We stand at a rare moment in history – the peak of a global debt super-cycle, the peak of a monetary experiment (QE infinity), the peak of a cycle of complacency. The next chapters will be painful for many, but they don’t have to be for those who see clearly. In 2008, those who heeded early warnings (shorted subprime, got out of stocks, etc.) not only survived but thrived. I believe similar opportunities (and risks) are here now.
I will leave you with this image: The Emperor (the economy/market) is strutting down Wall Street, cheered on by economists, commentators, and politicians who marvel at its strength. But look closer – the splendid garments are imaginary. The Emperor is naked, vulnerable to the cold reality about to hit. I’m that boy yelling from the crowd that a crash is coming. It takes a bit of courage to do it, knowing I’ll be ridiculed until the moment it happens. But I’d rather speak up than be silent. Because when the Emperor stumbles – and he will – it will be too late for those who refused to see.
History may not repeat, but it certainly rhymes. 2000, 2008… 2025. The rhyme is there for those willing to hear it. This is your final warning.
– Henrik Zeberg, Economist
JOIN ME HERE:
Monthly Publication:
https://swissblock.net/products/reports/zeberg-letter
…or here for Weekly Updates and close interaction with me:
https://swissblock.net/products/sem
Sources: My analysis incorporates data from the Conference Board, Federal Reserve, NAHB, Department of Labor, and others. Selected references and charts: Zeberg Business Cycle Model and economic data. All charts are as of June 2025.
I don’t know if Henrik is right or not, none of us do, not even Henrik can know until after we roll over the eventual top. But I will say that there were very few folks calling Bull in 2022; Henrik did so. Perma-anythings can be ignored, but folks whose opinions change as the setup changes are to be listened to. Fantastic note Henrik! - Alex .
Great post. Thanks Henrik